Fig. B.1.
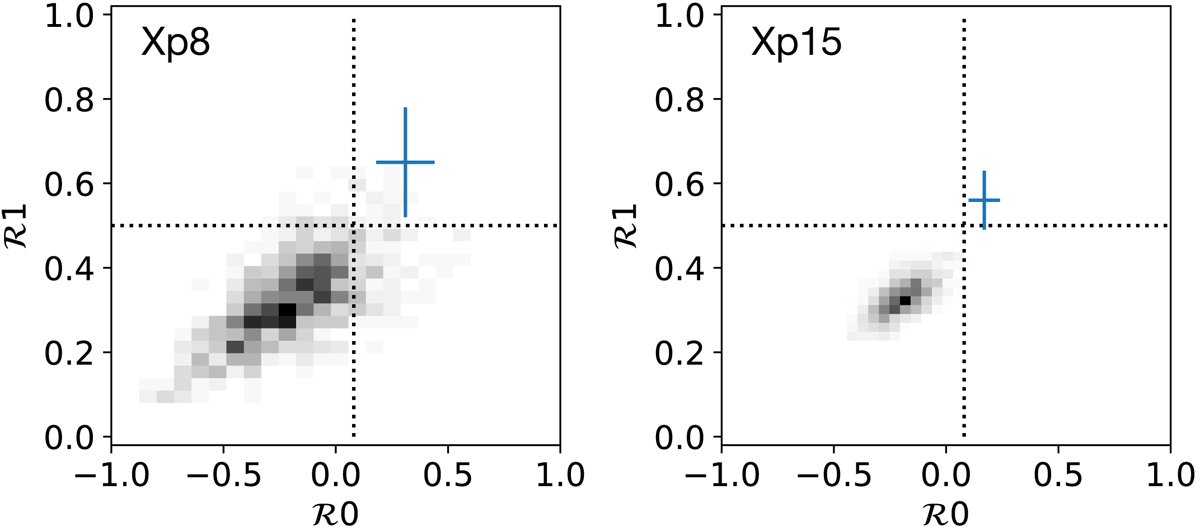
Bi-dimensional histograms of simulated ℛ0 and ℛ1, assuming a featureless power-law spectrum with the observed source brightness and spectral slope for Xp8 (Left) and Xp15 (Right). The vertical and horizontal dotted lines indicate the adopted thresholds for Fe XXV-excess source selection, ℛ0 > 0.08 and ℛ1 > 0.5. The cross in each panel indicates the observed point.
Current usage metrics show cumulative count of Article Views (full-text article views including HTML views, PDF and ePub downloads, according to the available data) and Abstracts Views on Vision4Press platform.
Data correspond to usage on the plateform after 2015. The current usage metrics is available 48-96 hours after online publication and is updated daily on week days.
Initial download of the metrics may take a while.