Fig. 7.
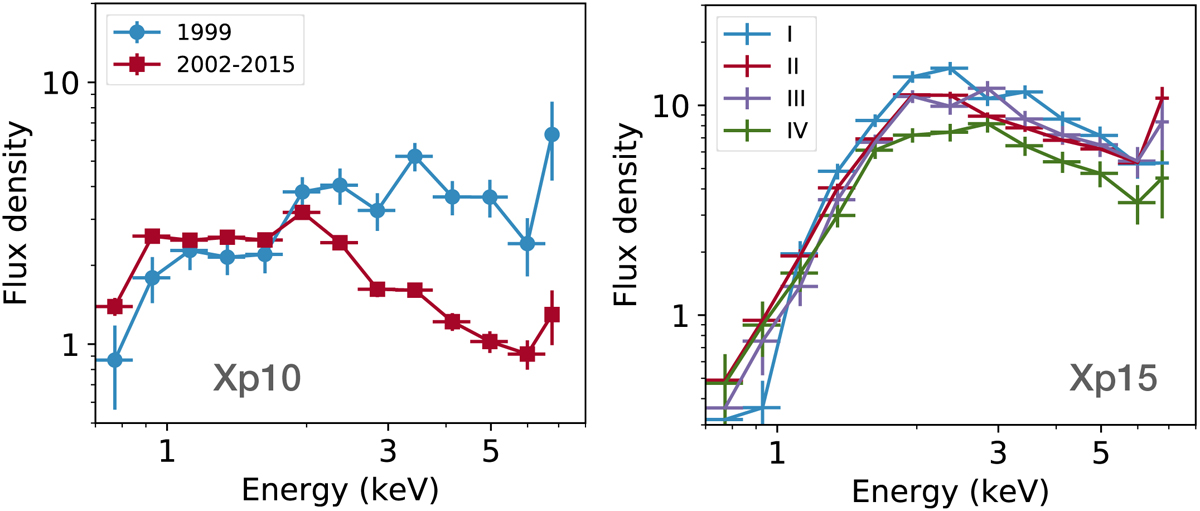
Low-resolution 0.7–7 keV spectra of Xp10 (Left) and Xp15 (Right), taken in various epochs. For Xp10, data from the two ACIS-I observations in 1999 and all the other 11 exposures (the same data as presented in Fig. 3) are shown. For Xp15, data from the four periods between 1999 and 2015 (Table 1) are shown. The flux density units are the same as in Fig. 3.
Current usage metrics show cumulative count of Article Views (full-text article views including HTML views, PDF and ePub downloads, according to the available data) and Abstracts Views on Vision4Press platform.
Data correspond to usage on the plateform after 2015. The current usage metrics is available 48-96 hours after online publication and is updated daily on week days.
Initial download of the metrics may take a while.