Free Access
Fig. 6.
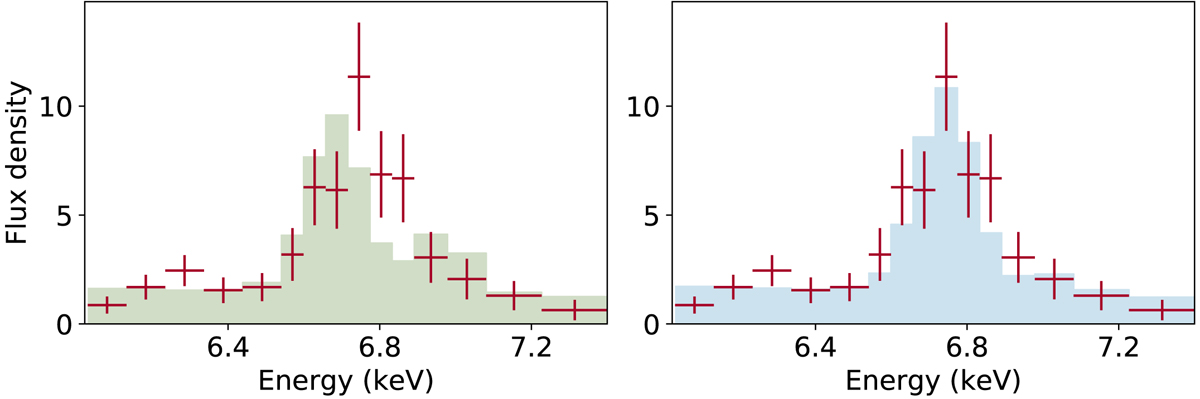
Fe K band spectrum of Xp12. Left: observed data (red) with the best-fit apec model with no velocity shift (green shade) relative to the systemic velocity (203 km s−1). Right: same data but with the model with the velocity shift being fitted (blue shade, v = −2700 km s−1).
Current usage metrics show cumulative count of Article Views (full-text article views including HTML views, PDF and ePub downloads, according to the available data) and Abstracts Views on Vision4Press platform.
Data correspond to usage on the plateform after 2015. The current usage metrics is available 48-96 hours after online publication and is updated daily on week days.
Initial download of the metrics may take a while.