Fig. 2.
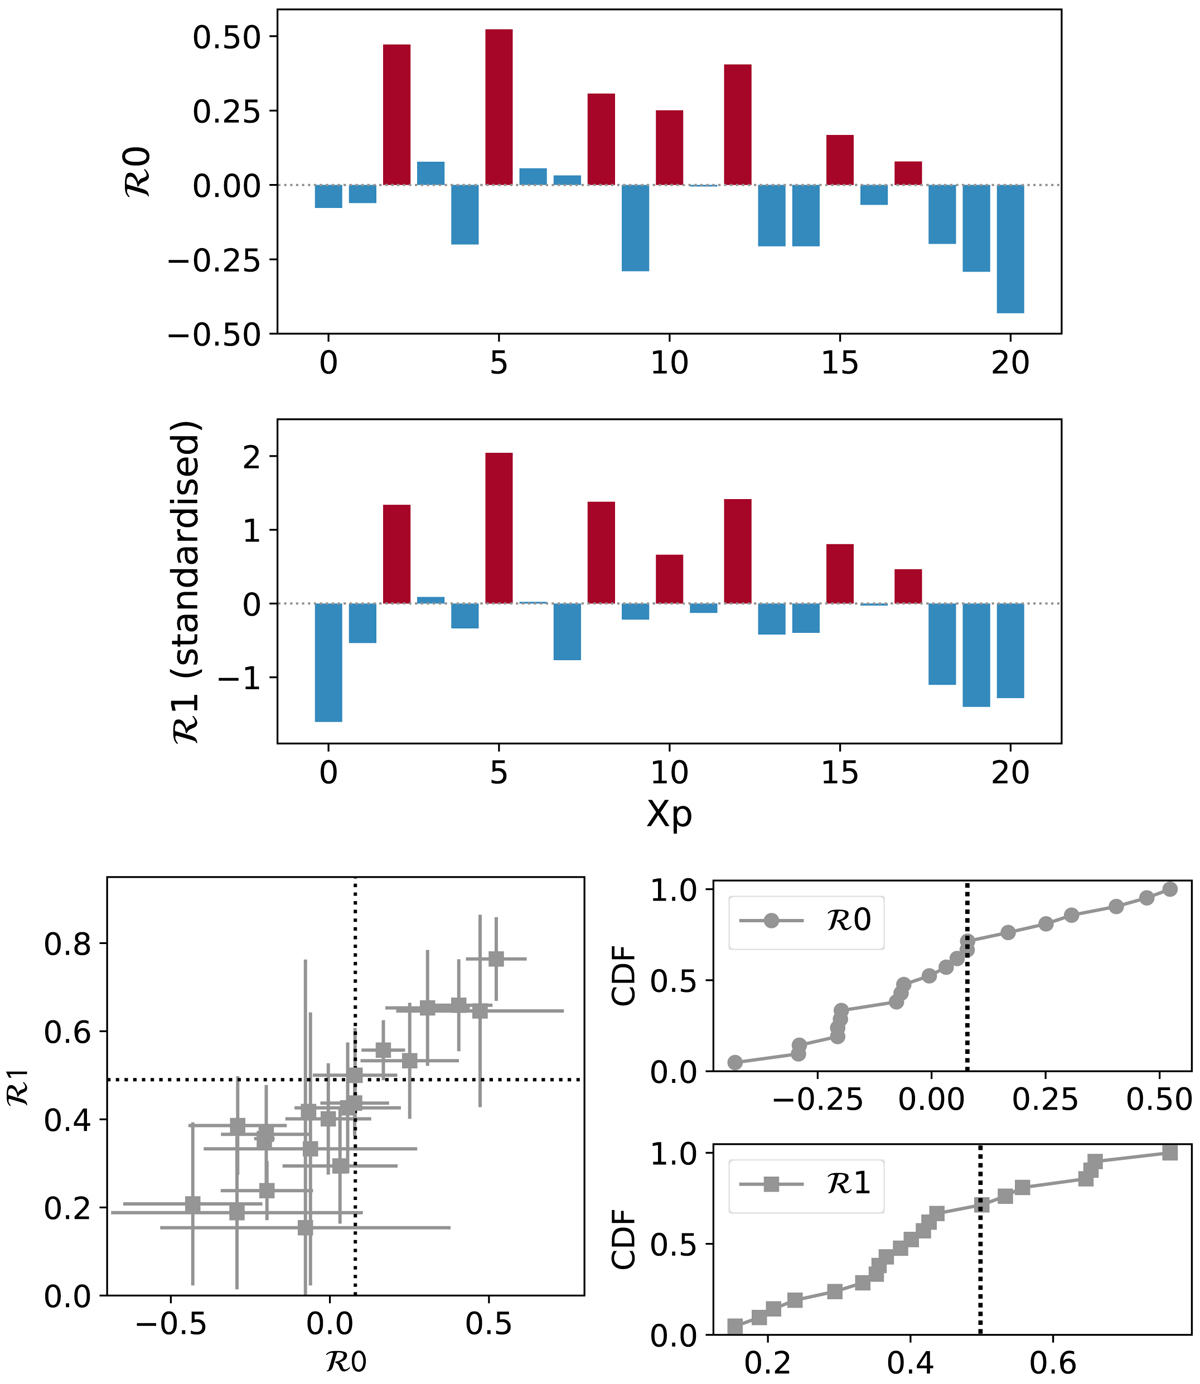
Two measures of Fe xvv excess, ℛ0 and ℛ1 (see text for their definition), for the 21 discrete sources, Xp0 through Xp20. ℛ1 values in the bar plot are standardised. Seven selected Fe XXV (NB2)-excess source candidates are marked in red. Lower left: ℛ0–ℛ1 diagram. Lower right: CDFs of ℛ0 and ℛ1. In both panels, dotted lines indicate the adopted thresholds for the NB2-excess selection.
Current usage metrics show cumulative count of Article Views (full-text article views including HTML views, PDF and ePub downloads, according to the available data) and Abstracts Views on Vision4Press platform.
Data correspond to usage on the plateform after 2015. The current usage metrics is available 48-96 hours after online publication and is updated daily on week days.
Initial download of the metrics may take a while.