Fig. 8
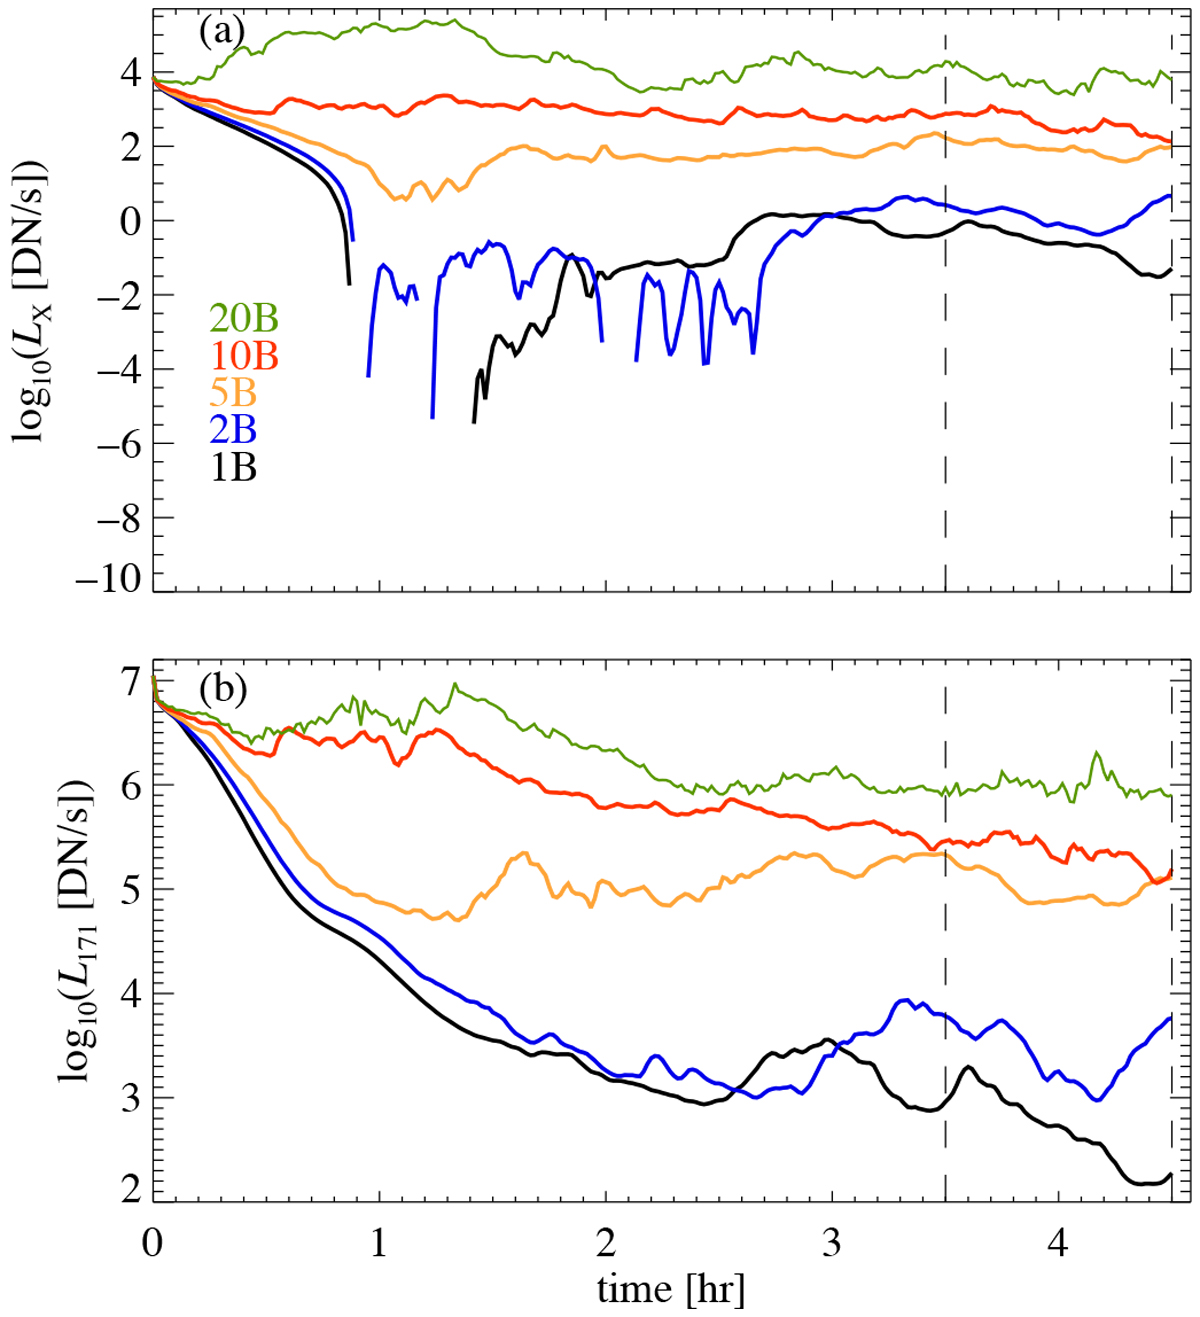
Temporal evolution of the coronal emission from integration over the whole computational domain. Panel a: X-ray emission as seen by XRT in the Al-poly filter. Panel b: EUV emission as it would be seen by AIA in the 171 Å channel. The vertical dashed lines indicate the time-span used for time averaging. The colors represent the different runs as indicated in the legend (cf. Table 1). See Sect. 4.4.
Current usage metrics show cumulative count of Article Views (full-text article views including HTML views, PDF and ePub downloads, according to the available data) and Abstracts Views on Vision4Press platform.
Data correspond to usage on the plateform after 2015. The current usage metrics is available 48-96 hours after online publication and is updated daily on week days.
Initial download of the metrics may take a while.