Fig. 7
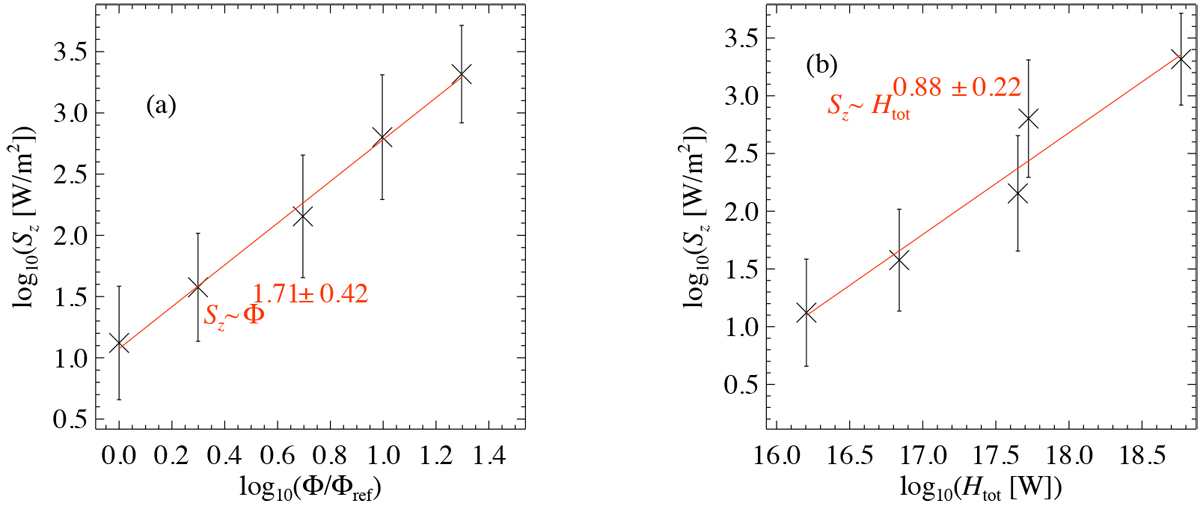
Scaling of average Poynting flux ⟨Sz⟩ with unsigned surface flux Φ and average coronal heating ⟨Htot⟩. Each data point represents an average for one of the model runs with different unsigned surface magnetic flux as listed in Table 1. As a reference for the magnetic flux, Φref, we choose the magnetic flux of the least active setup, run 1B (cf. Table 1). The bars represent the standard deviation of Sz in time. The red lines are power-law fits to the data. See Sects. 5 and 6.1.
Current usage metrics show cumulative count of Article Views (full-text article views including HTML views, PDF and ePub downloads, according to the available data) and Abstracts Views on Vision4Press platform.
Data correspond to usage on the plateform after 2015. The current usage metrics is available 48-96 hours after online publication and is updated daily on week days.
Initial download of the metrics may take a while.