Fig. 5
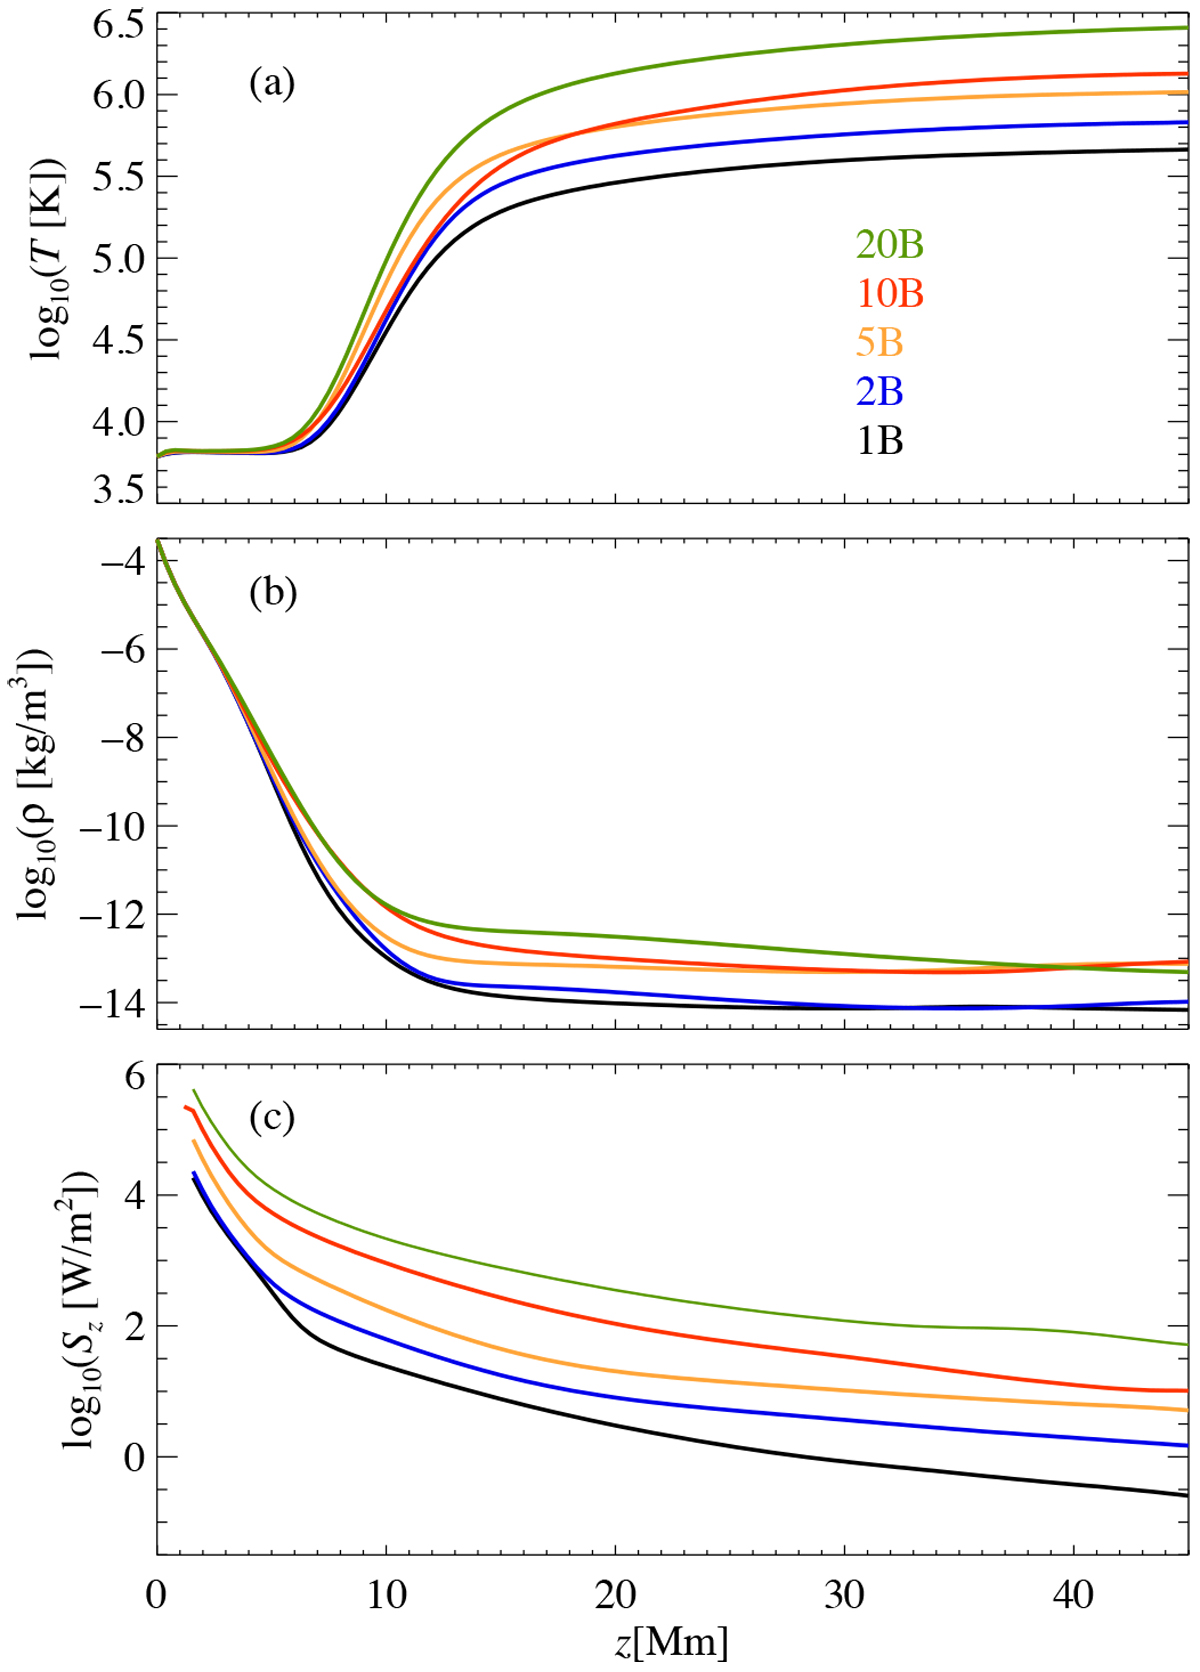
Horizontal averaged quantities as a function of height. We show temperature T (panel a), density ρ (panel b), and the vertical component of the Poynting flux Sz (panel c). The colors represent the different runs as indicated in the legend (cf. Table 1). The quantities are averaged horizontally for each snapshot and then in time for 1 h (between the time-point at 3.5 and that at 4.5 h, as indicatedin Fig. 4 by the vertical dashed lines. For the Poynting flux we omitted the first three grid points that show boundary effects. See Sect. 4.3.
Current usage metrics show cumulative count of Article Views (full-text article views including HTML views, PDF and ePub downloads, according to the available data) and Abstracts Views on Vision4Press platform.
Data correspond to usage on the plateform after 2015. The current usage metrics is available 48-96 hours after online publication and is updated daily on week days.
Initial download of the metrics may take a while.