Fig. 3
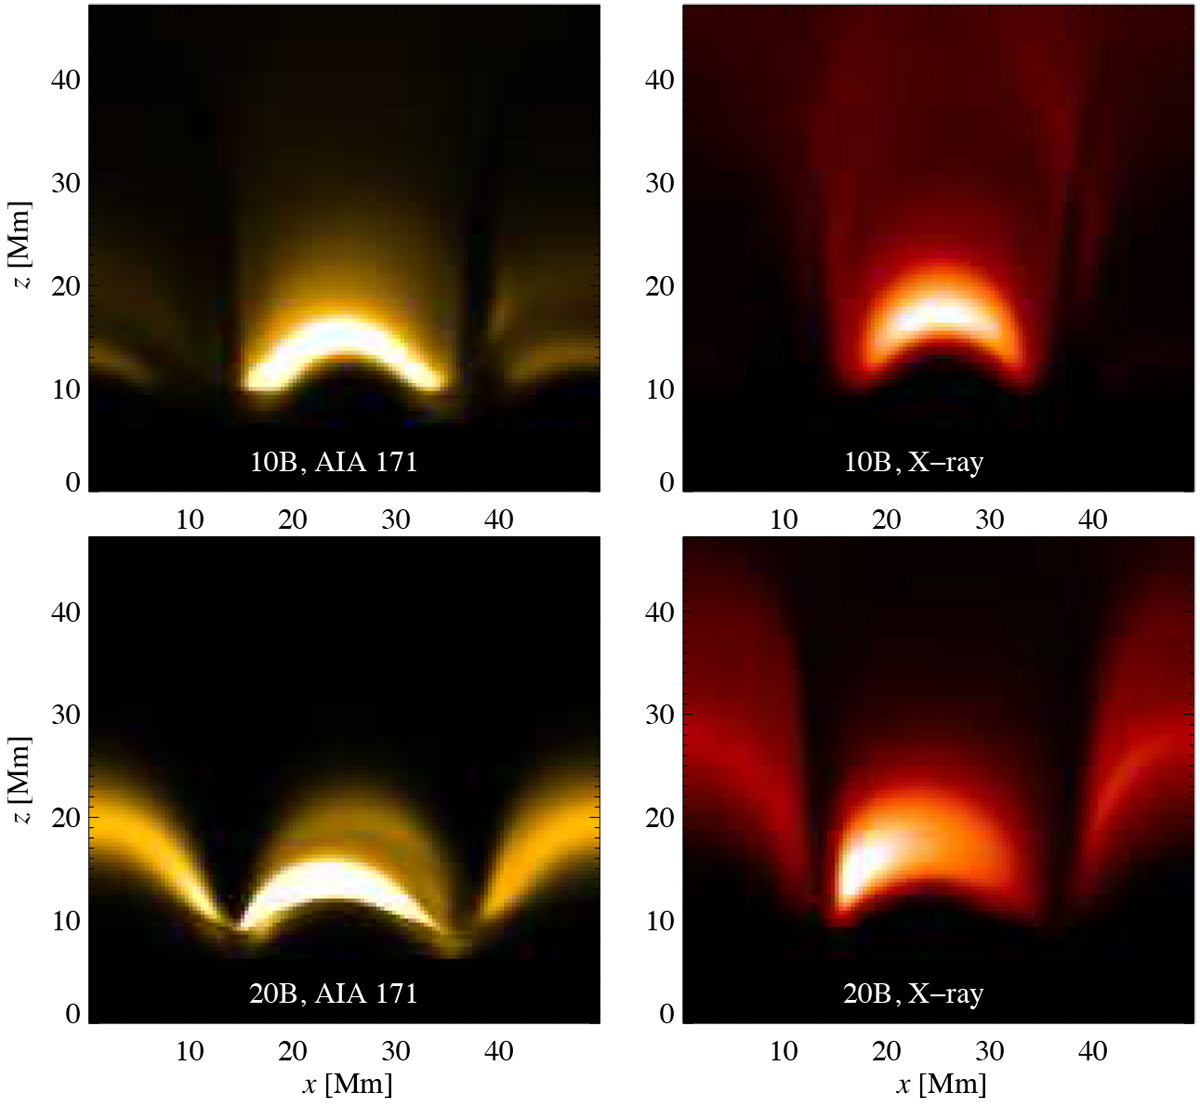
Side view of the computational domain showing coronal emission. Left two panels: emission as it would be seen by the 171 Å channel of AIA starting from around 1 MK. Two right-hand panels: X-ray emission as seen by XRT sampling higher temperatures. Here we show snapshots of the two more active models, runs 10B and 20B. The emission here is integrated along the y direction which corresponds to an observation near the limb (of the Sun or a star). The snapshot is taken at t = 230 min; i.e., in the relaxed state. See Sect. 4.2.
Current usage metrics show cumulative count of Article Views (full-text article views including HTML views, PDF and ePub downloads, according to the available data) and Abstracts Views on Vision4Press platform.
Data correspond to usage on the plateform after 2015. The current usage metrics is available 48-96 hours after online publication and is updated daily on week days.
Initial download of the metrics may take a while.