Fig. 2
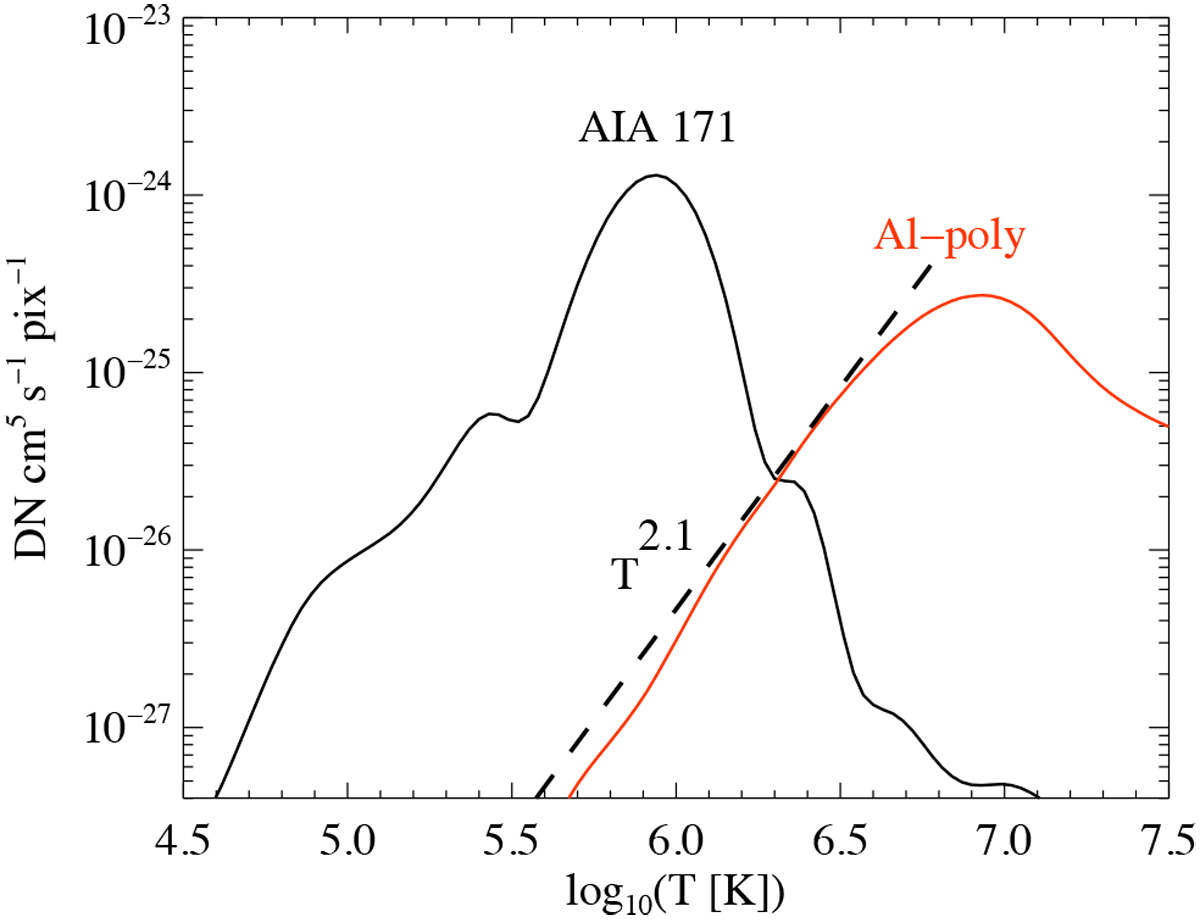
Temperature response function for the AIA instrument on board SDO and the XRT on board Hinode. The black line shows the 171 Å channel of the AIA, the red line shows the Al-poly filter of the XRT. For illustration purposes, the black dashed line indicates a power-law approximation to XRT at temperatures below 107 K. See Sect. 4.2.
Current usage metrics show cumulative count of Article Views (full-text article views including HTML views, PDF and ePub downloads, according to the available data) and Abstracts Views on Vision4Press platform.
Data correspond to usage on the plateform after 2015. The current usage metrics is available 48-96 hours after online publication and is updated daily on week days.
Initial download of the metrics may take a while.