Fig. 10
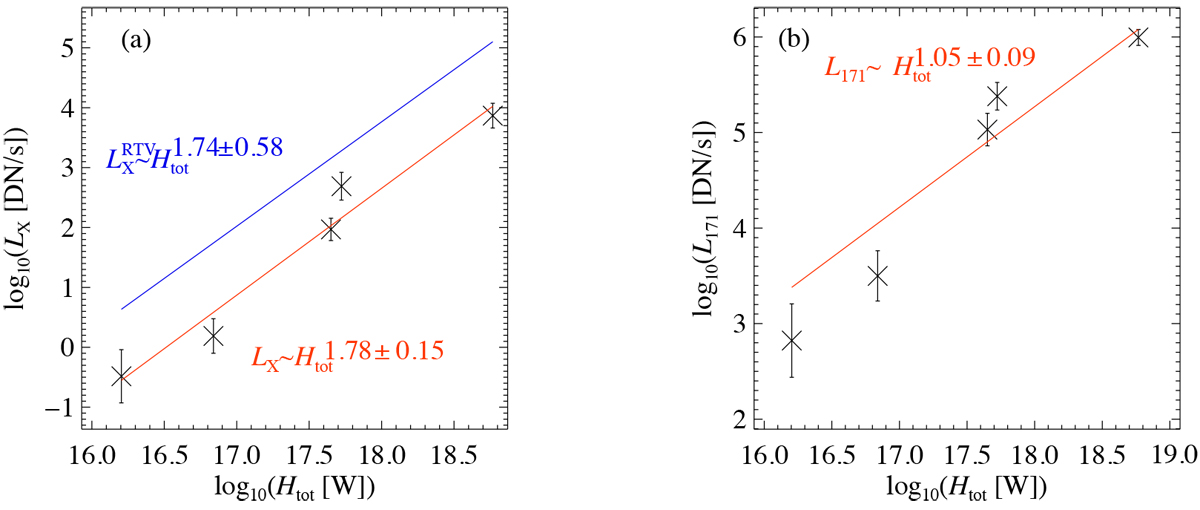
Scaling of average X-ray and 171 Å emission as observed by AIA, ⟨LX⟩, and ⟨ L171⟩ with averagecoronal heating ⟨Htot⟩ for model runs listed in Table 1. The bars represent the standard deviation of LX and L171 in time. The red lines are power-law fits to the data. The blue line in panel a indicates what is expected from the RTV scaling laws. See Sects. 5 and 6.5.
Current usage metrics show cumulative count of Article Views (full-text article views including HTML views, PDF and ePub downloads, according to the available data) and Abstracts Views on Vision4Press platform.
Data correspond to usage on the plateform after 2015. The current usage metrics is available 48-96 hours after online publication and is updated daily on week days.
Initial download of the metrics may take a while.