Fig. 8.
Download original image
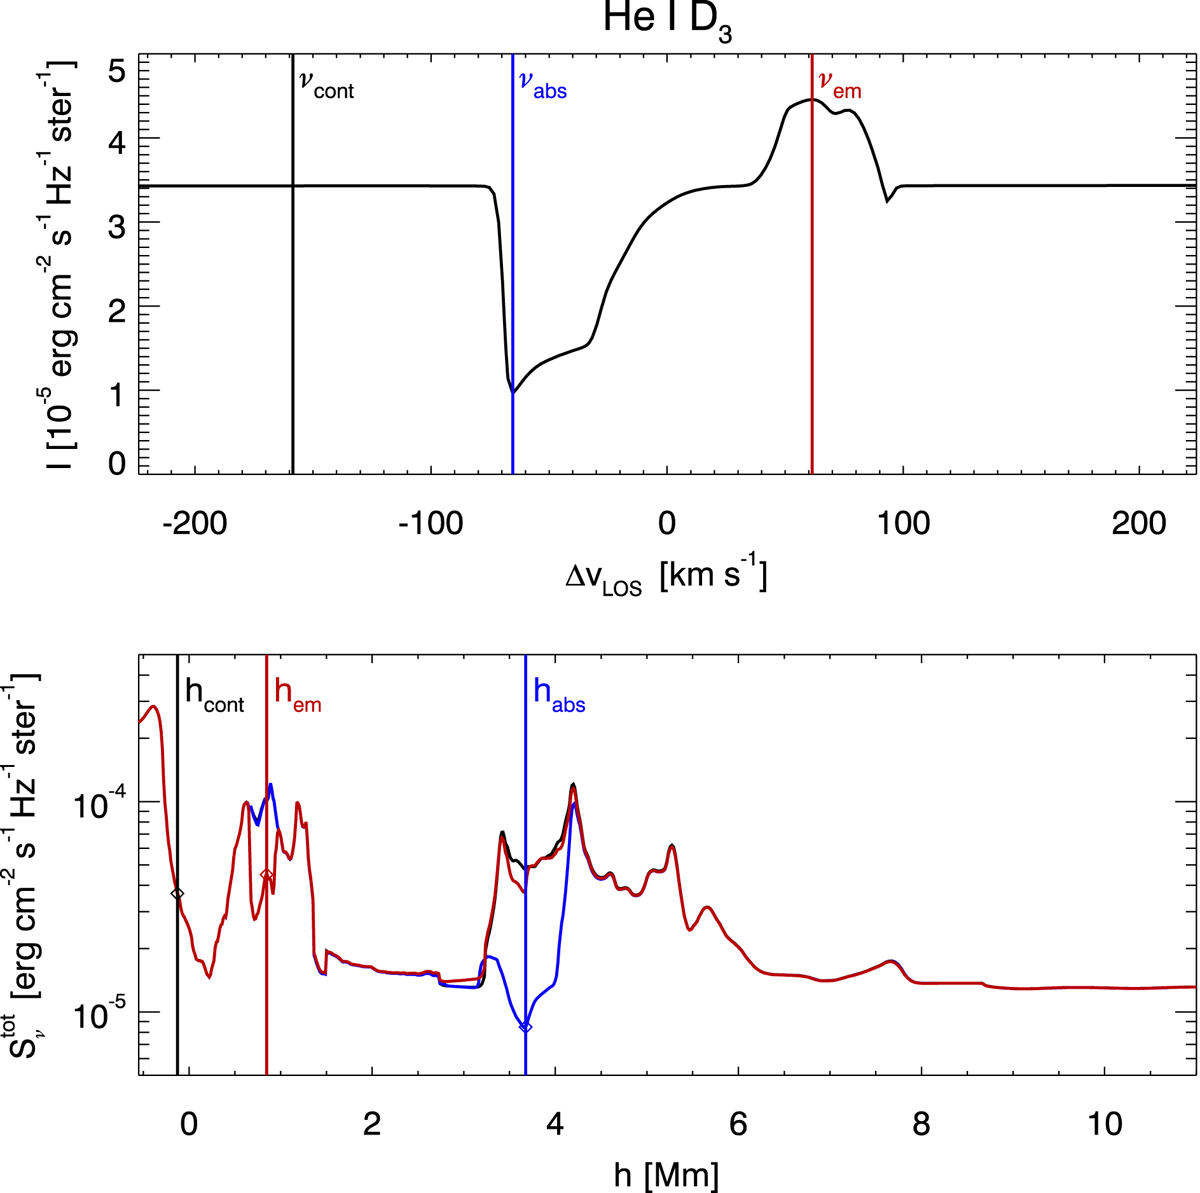
Comparison of the emergent intensity and the source function of an EB He I D3 emission profile. Top panel: emergent intensity. Three vertical lines in black, blue, and red correspond to three selected frequencies νcont, νabs, and νem. Bottom panel: total source function at three different frequencies ![]() (black),
(black), ![]() (blue), and
(blue), and ![]() (red). The indications hcont, habs, and hem correspond to the heights at which τ(νcont), τ(νabs), and τ(νem) are equal to one.
(red). The indications hcont, habs, and hem correspond to the heights at which τ(νcont), τ(νabs), and τ(νem) are equal to one.
Current usage metrics show cumulative count of Article Views (full-text article views including HTML views, PDF and ePub downloads, according to the available data) and Abstracts Views on Vision4Press platform.
Data correspond to usage on the plateform after 2015. The current usage metrics is available 48-96 hours after online publication and is updated daily on week days.
Initial download of the metrics may take a while.