Fig. 6.
Download original image
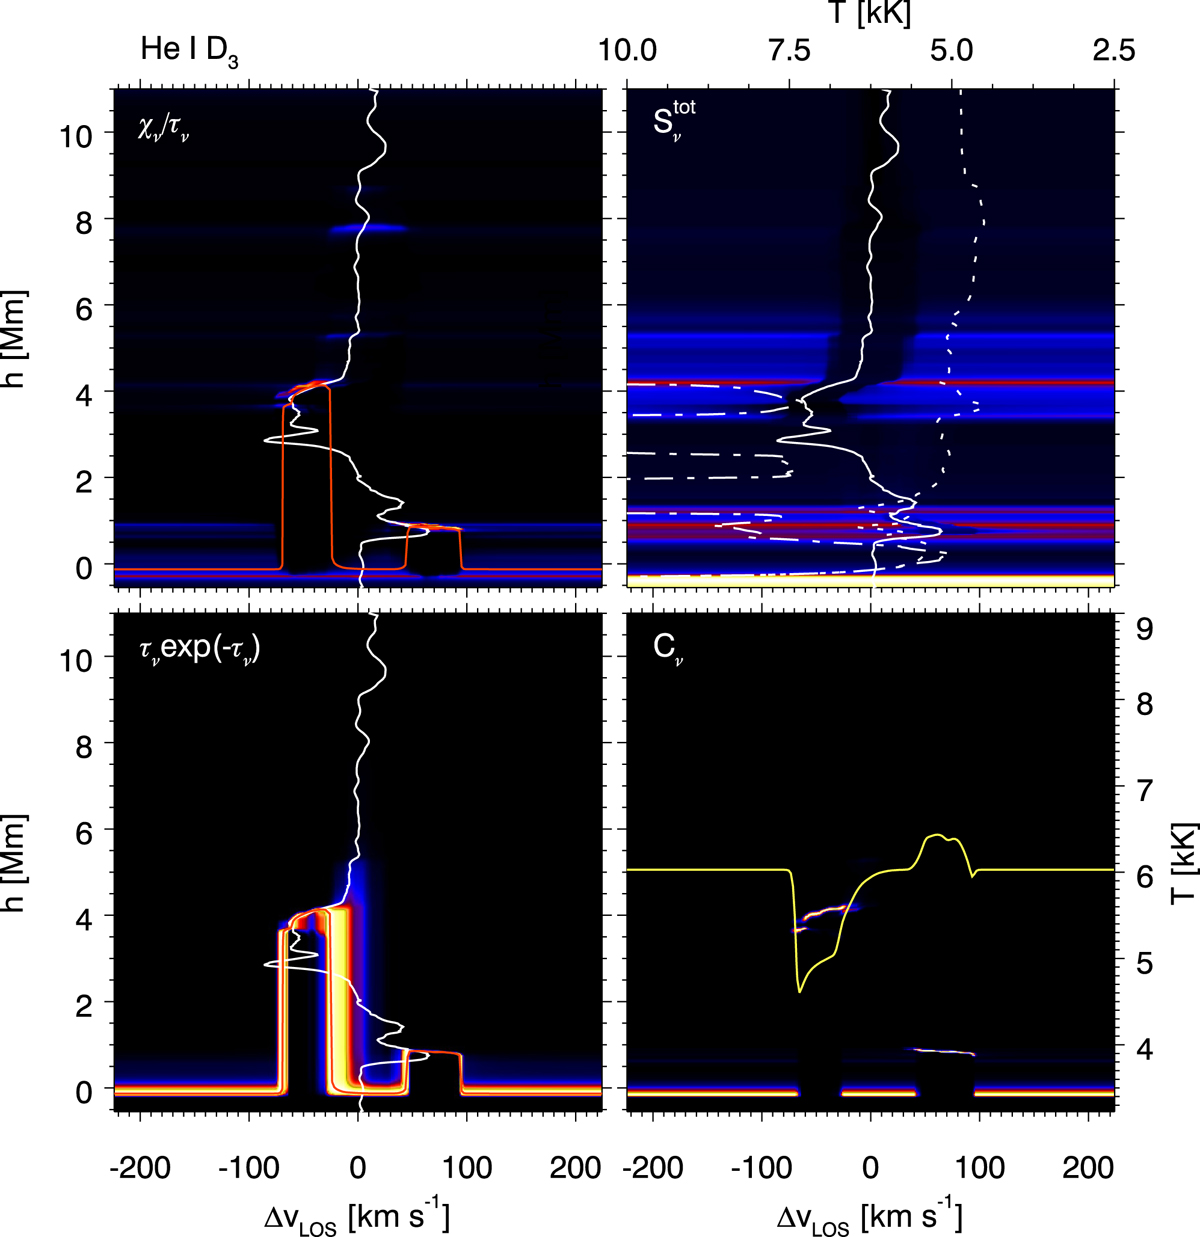
Line formation plot with all factors that make up the contribution function (Eq. (3)) of the EB He I D3 emission profile at location Lem (see Fig. 5) and at a heliocentric viewing angle of μ = 1. Top left: opacity χν divided by optical depth τν. The hmax, ℓ surface (Eq. (2)) is shown as a solid red line and the vertical velocity vz as a solid white line. Top right: total source function ![]() (Eq. (4)). The vertical velocity vz is shown as a solid white line, the temperature T as a dot-dashed line, and the line source function Sl in temperature units as a dotted line. Bottom left: τνe−τν, which displays the height range where τν is close to 1. The τν = 1 surface is shown as a solid red line and the vertical velocity vz as a solid white line. Bottom right: total contribution function. The emergent intensity is shown on a temperature scale as a yellow solid line.
(Eq. (4)). The vertical velocity vz is shown as a solid white line, the temperature T as a dot-dashed line, and the line source function Sl in temperature units as a dotted line. Bottom left: τνe−τν, which displays the height range where τν is close to 1. The τν = 1 surface is shown as a solid red line and the vertical velocity vz as a solid white line. Bottom right: total contribution function. The emergent intensity is shown on a temperature scale as a yellow solid line.
Current usage metrics show cumulative count of Article Views (full-text article views including HTML views, PDF and ePub downloads, according to the available data) and Abstracts Views on Vision4Press platform.
Data correspond to usage on the plateform after 2015. The current usage metrics is available 48-96 hours after online publication and is updated daily on week days.
Initial download of the metrics may take a while.