Fig. 4.
Download original image
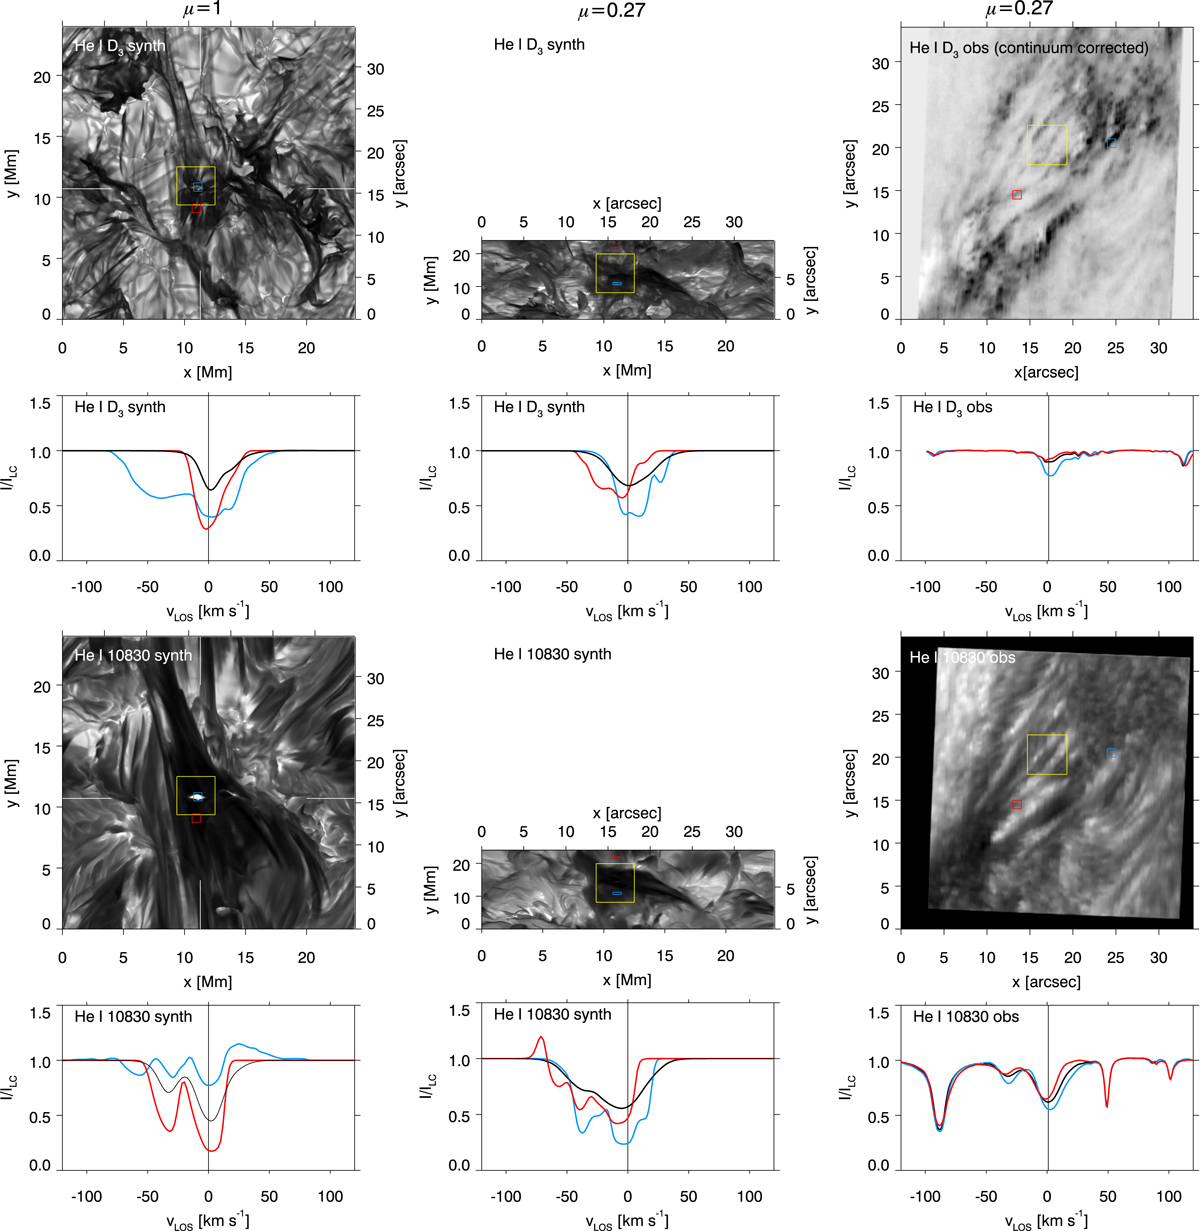
Comparison of a simulated and observed flux emergence region in He I 10 830 Å and He I D3. Top two rows: He I D3 images and spectra, and lower two rows: He I 10 830 Å images and spectra. Left column: synthetic data at μ = 1, middle column: synthetic data at μ = 0.27, and right column: observed data at μ = 0.27. The He I D3 observed image is normalized by the local continuum. The red and blue squares in the images indicate areas over which the spectra are averaged that are displayed in the corresponding color in the panel below the image. The black spectrum is an average over the entire field of view shown in the image. The He I 10 830 Å observed spectral region also contains a Si I line at vLOS ∼ −85 km s−1 and two telluric lines at vLOS ∼ 50 km s−1 and vLOS ∼ 100 km s−1. The vertical black lines on the spectra indicate the wavelength position at which the image is shown. We have adopted the observer point of view for Doppler shifts in which a negative vLOS corresponds to a blueshift in the spectral line. The larger yellow squares correspond to the regions that are zoomed into in Fig. 5. Vertical slices along the white markers in the synthetic μ = 1 images are shown in Figs. 1 and 3.
Current usage metrics show cumulative count of Article Views (full-text article views including HTML views, PDF and ePub downloads, according to the available data) and Abstracts Views on Vision4Press platform.
Data correspond to usage on the plateform after 2015. The current usage metrics is available 48-96 hours after online publication and is updated daily on week days.
Initial download of the metrics may take a while.