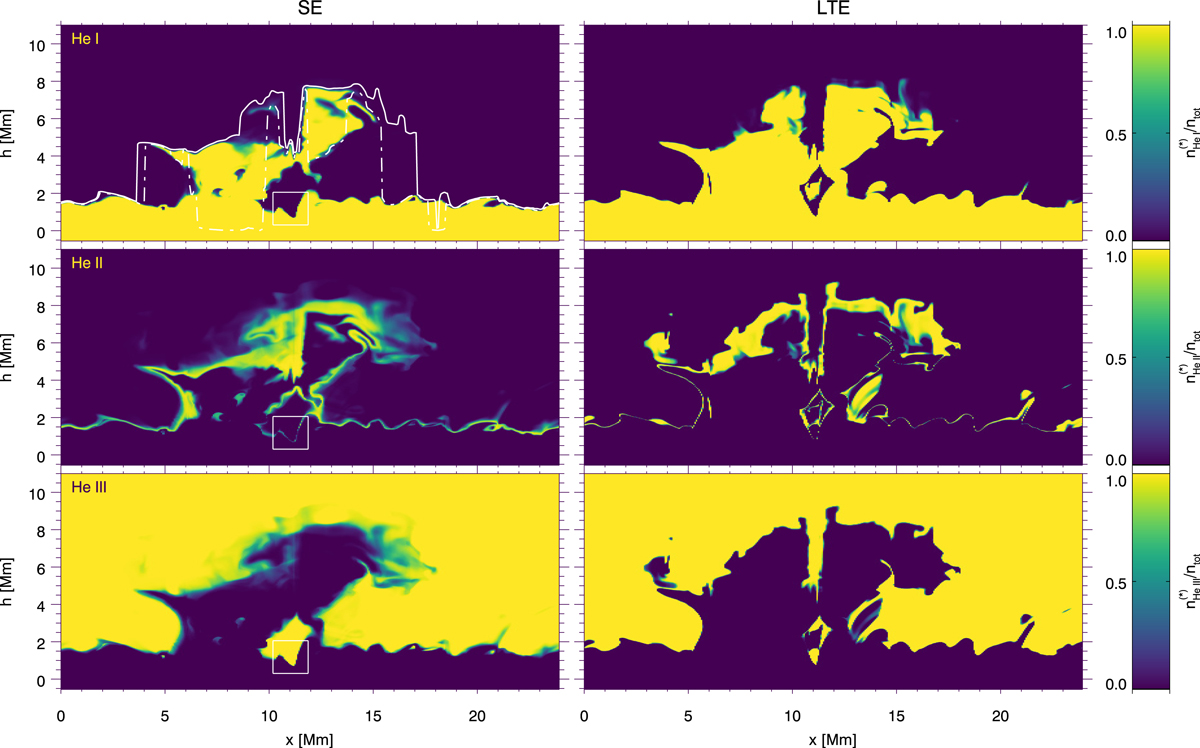
Fig. 3.
Download original image
Vertical cuts through the rMHD snapshot intersecting the y-axis at the EB location y = 10.7 Mm. Left column: statistical equilibrium (SE) He I, II, and III population relative to the total population. Right column: LTE He I, II, and III populations relative to the total population. hmax, 10 830 (solid line) and hmax, D3 (dash-dotted line) are plotted in the upper left panel; see the definition in Eq. (2). The white boxes in the left panels indicate the region that we zoom into in Figs. 10, 11, and 13.
Current usage metrics show cumulative count of Article Views (full-text article views including HTML views, PDF and ePub downloads, according to the available data) and Abstracts Views on Vision4Press platform.
Data correspond to usage on the plateform after 2015. The current usage metrics is available 48-96 hours after online publication and is updated daily on week days.
Initial download of the metrics may take a while.