Fig. 13.
Download original image
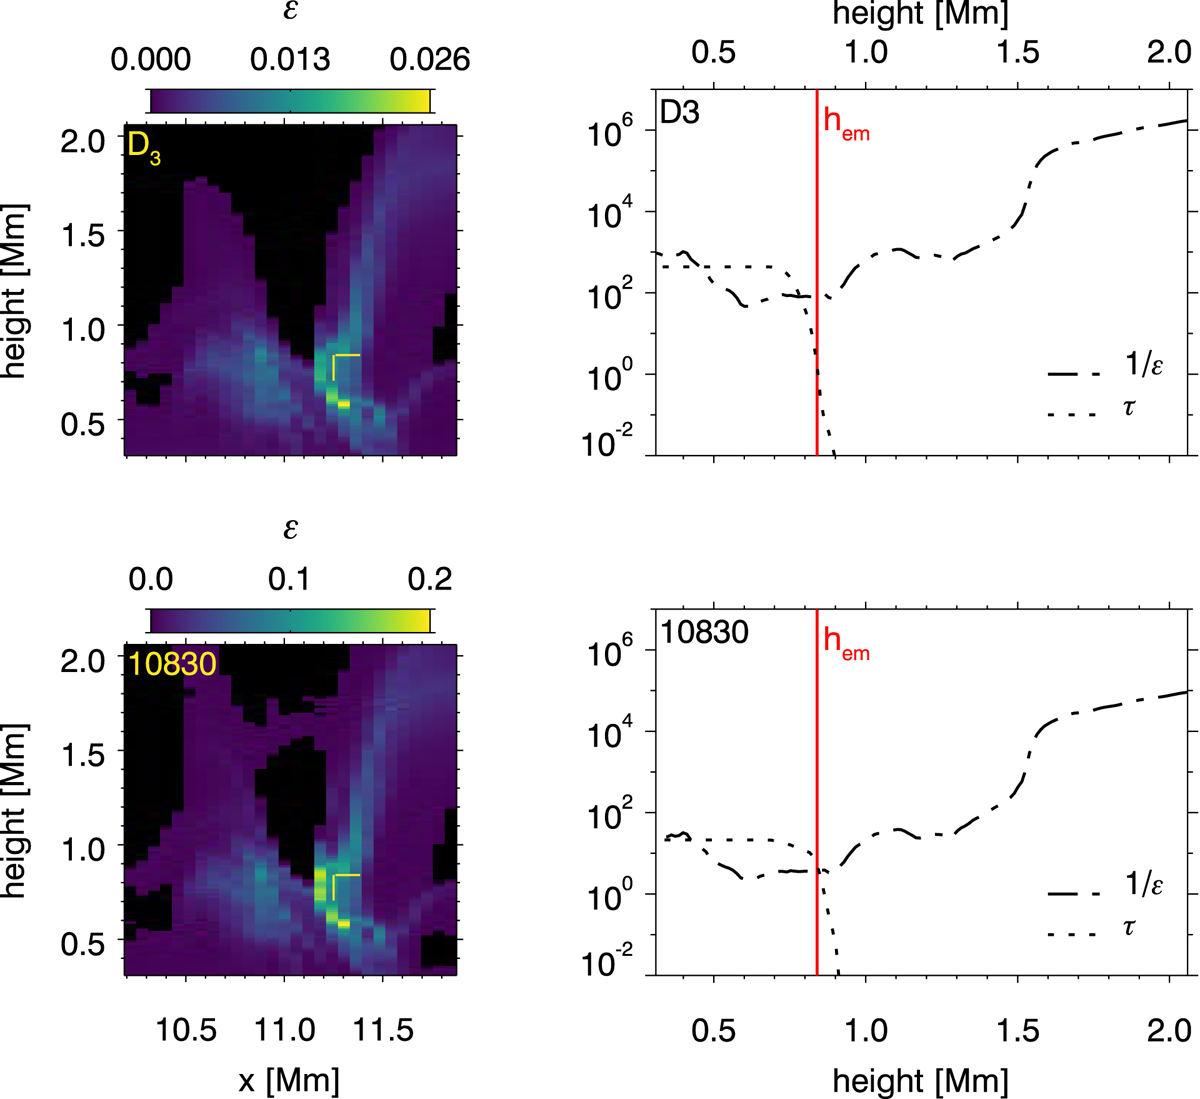
Properties of a cutout along the x-axis of the lower part of the EB (indicated as a white box in Figs. 1 and 3). Top left: destruction probability ϵ of He I D3. Bottom left: same for He I 10 830 Å. Top right: thermalization length 1/ϵ (see Eq. (16)) in units of optical depth as a function of height at location Lem (see Fig. 5), plotted together with the optical depth τν at νem (see Fig. 8). hem as defined in Fig. 8 is overplotted as a vertical line. Bottom right: same for He I 10 830 Å.
Current usage metrics show cumulative count of Article Views (full-text article views including HTML views, PDF and ePub downloads, according to the available data) and Abstracts Views on Vision4Press platform.
Data correspond to usage on the plateform after 2015. The current usage metrics is available 48-96 hours after online publication and is updated daily on week days.
Initial download of the metrics may take a while.