Fig. 12.
Download original image
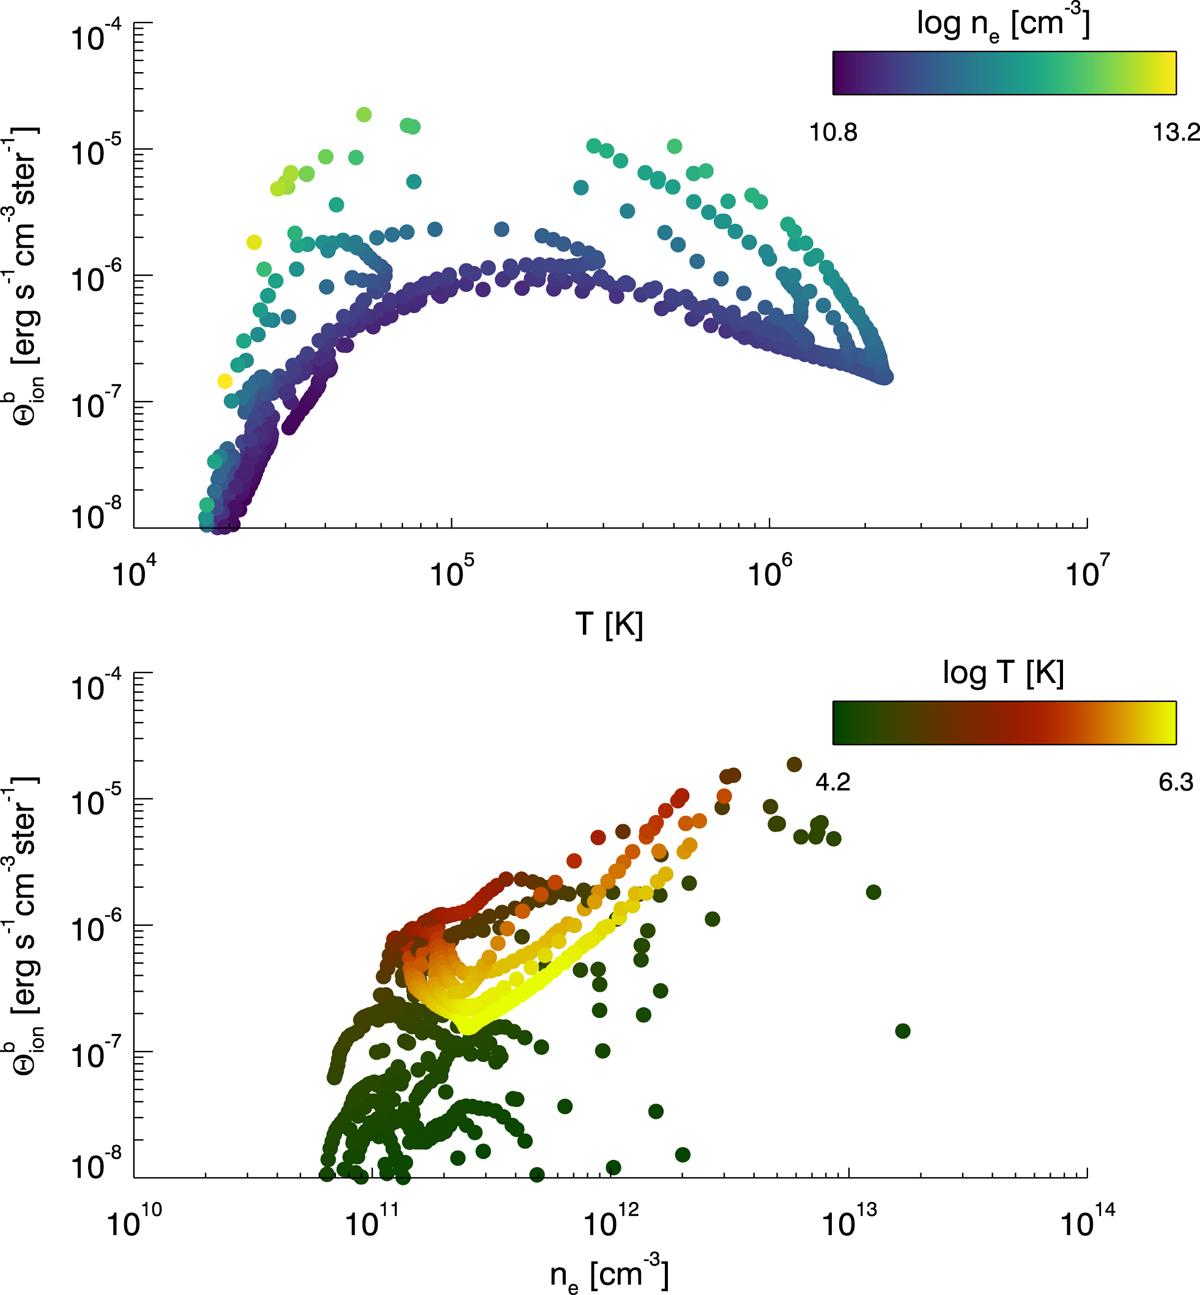
Top: all pixels in Fig. 11 in which ![]() erg s−1 cm−3 ster−1 plotted as a function of the temperature in that pixel. The color indicates the electron density in the same pixel. Bottom: all pixels in Fig. 11 in which
erg s−1 cm−3 ster−1 plotted as a function of the temperature in that pixel. The color indicates the electron density in the same pixel. Bottom: all pixels in Fig. 11 in which ![]() erg s−1 cm−3 ster−1 plotted as a function of electron density in that pixel. The color indicates the temperature in the same pixel.
erg s−1 cm−3 ster−1 plotted as a function of electron density in that pixel. The color indicates the temperature in the same pixel.
Current usage metrics show cumulative count of Article Views (full-text article views including HTML views, PDF and ePub downloads, according to the available data) and Abstracts Views on Vision4Press platform.
Data correspond to usage on the plateform after 2015. The current usage metrics is available 48-96 hours after online publication and is updated daily on week days.
Initial download of the metrics may take a while.