Fig. 11.
Download original image
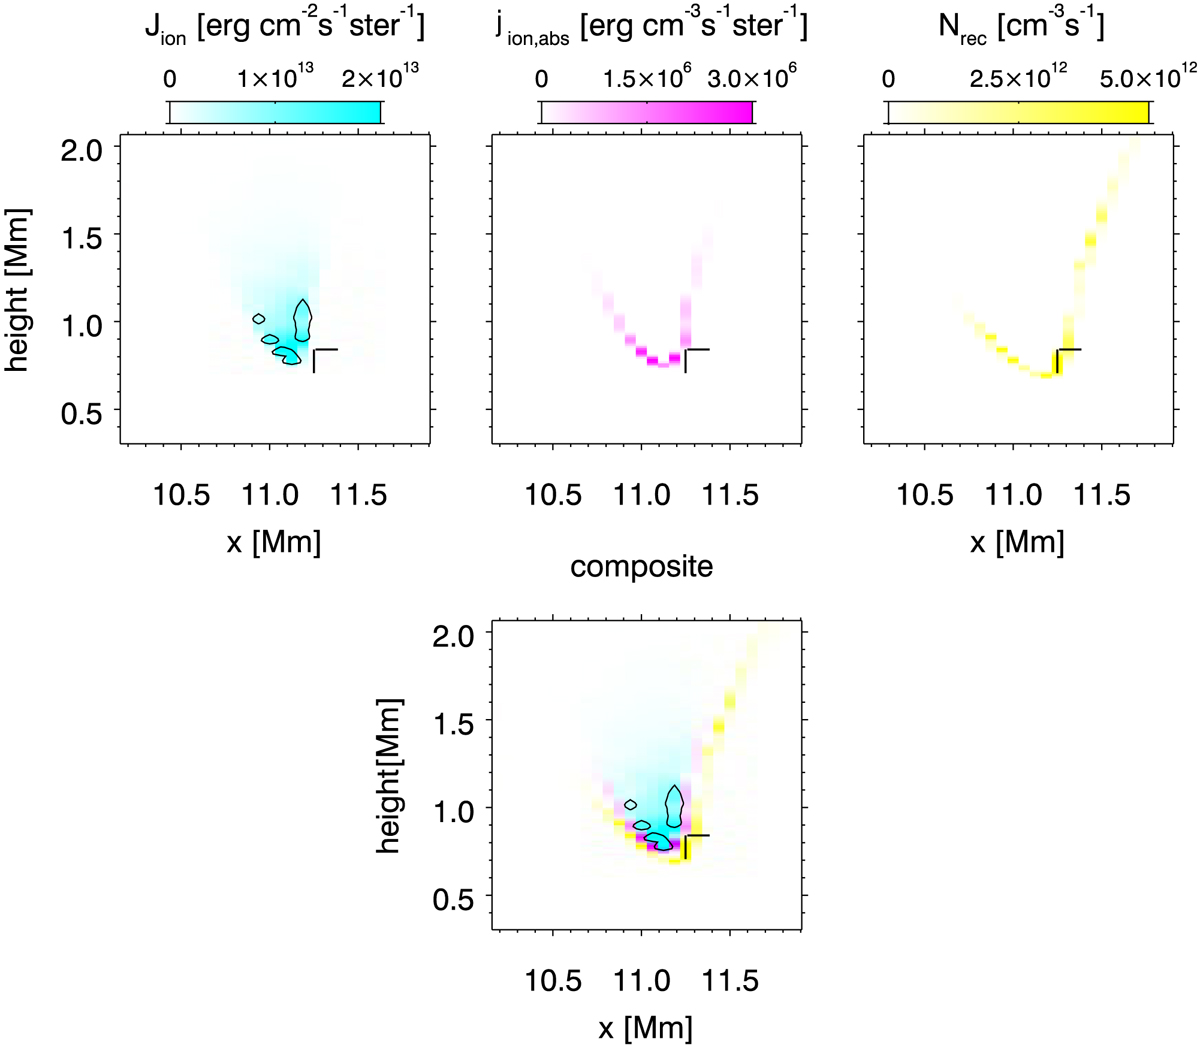
Properties of a cutout along the x-axis of the lower part of the EB (indicated as a white box in Figs. 1 and 3). Top left to right: frequency-integrated ionizing radiation field Jion (see Eq. (9)), where jion, abs is absorbed (see Eq. (14)), and total number of recombinations in the triplet system Nrec as defined Eq. (15). Bottom: composite panel of Jion, jion, abs, and Nrec. The black markers indicate the position of the He I D3 profile shown in Figs. 6 and 8 at locations Lem (see Fig. 5) and hem (see Fig. 8). The black contours show the regions in which ![]() erg s−1 cm−3 ster−1, see also Eq. (13).
erg s−1 cm−3 ster−1, see also Eq. (13).
Current usage metrics show cumulative count of Article Views (full-text article views including HTML views, PDF and ePub downloads, according to the available data) and Abstracts Views on Vision4Press platform.
Data correspond to usage on the plateform after 2015. The current usage metrics is available 48-96 hours after online publication and is updated daily on week days.
Initial download of the metrics may take a while.