Fig. 10.
Download original image
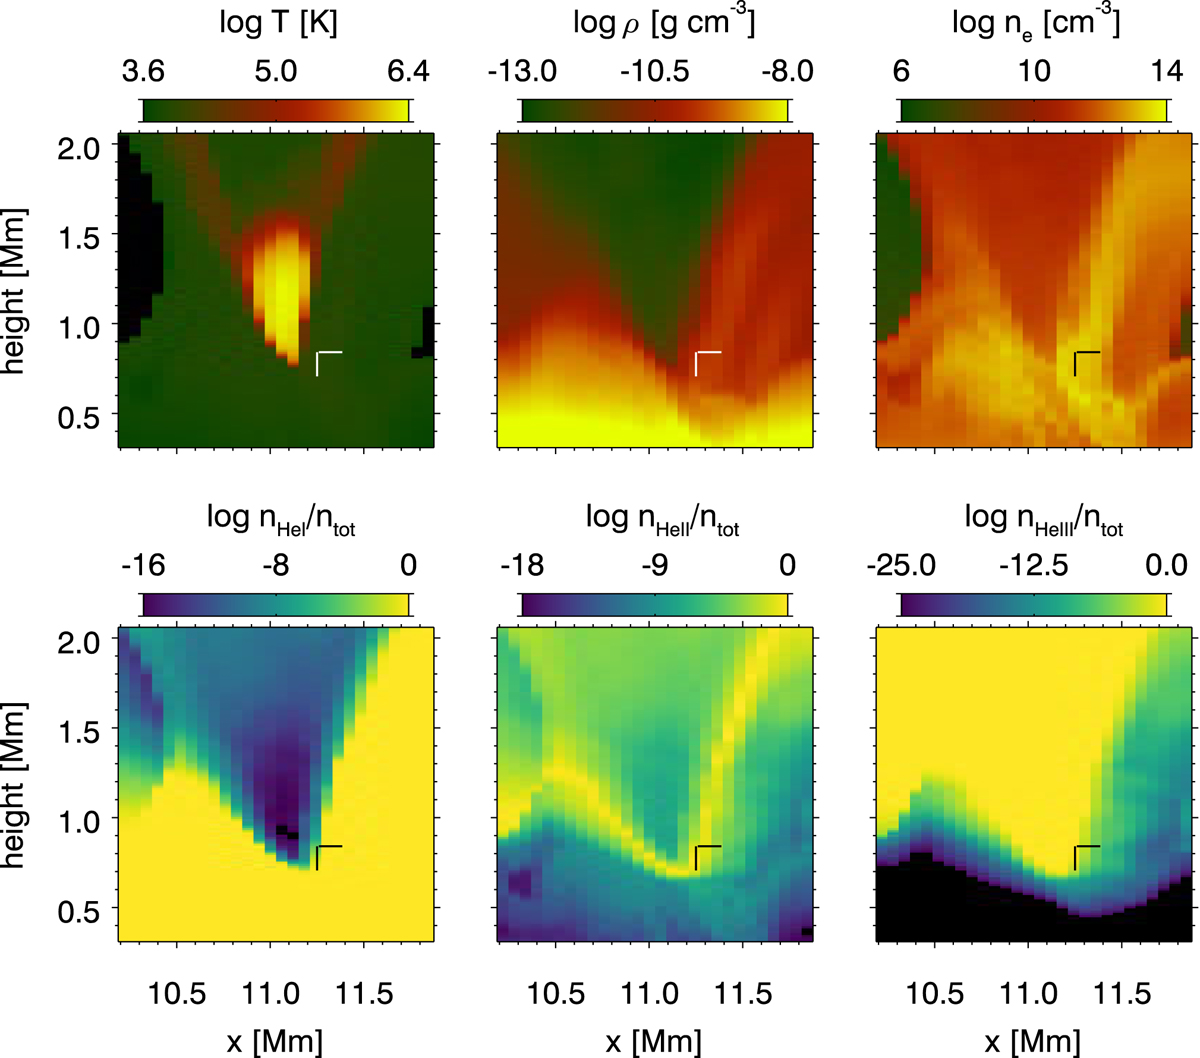
Properties of a cutout along the x-axis of the lower part of the EB (indicated as a white box in Figs. 1 and 3). Top row: temperature T, mass density ρ, and electron number density ne are shown on a log scale. Bottom row: ratio of the number density of He I, He II, and He III to the total number density of helium ntot are shown on a log scale. The black and white markers show the position of the He I D3 profile shown in Figs. 6 and 8 at locations Lem (see Fig. 5) and hem (see Fig. 8).
Current usage metrics show cumulative count of Article Views (full-text article views including HTML views, PDF and ePub downloads, according to the available data) and Abstracts Views on Vision4Press platform.
Data correspond to usage on the plateform after 2015. The current usage metrics is available 48-96 hours after online publication and is updated daily on week days.
Initial download of the metrics may take a while.