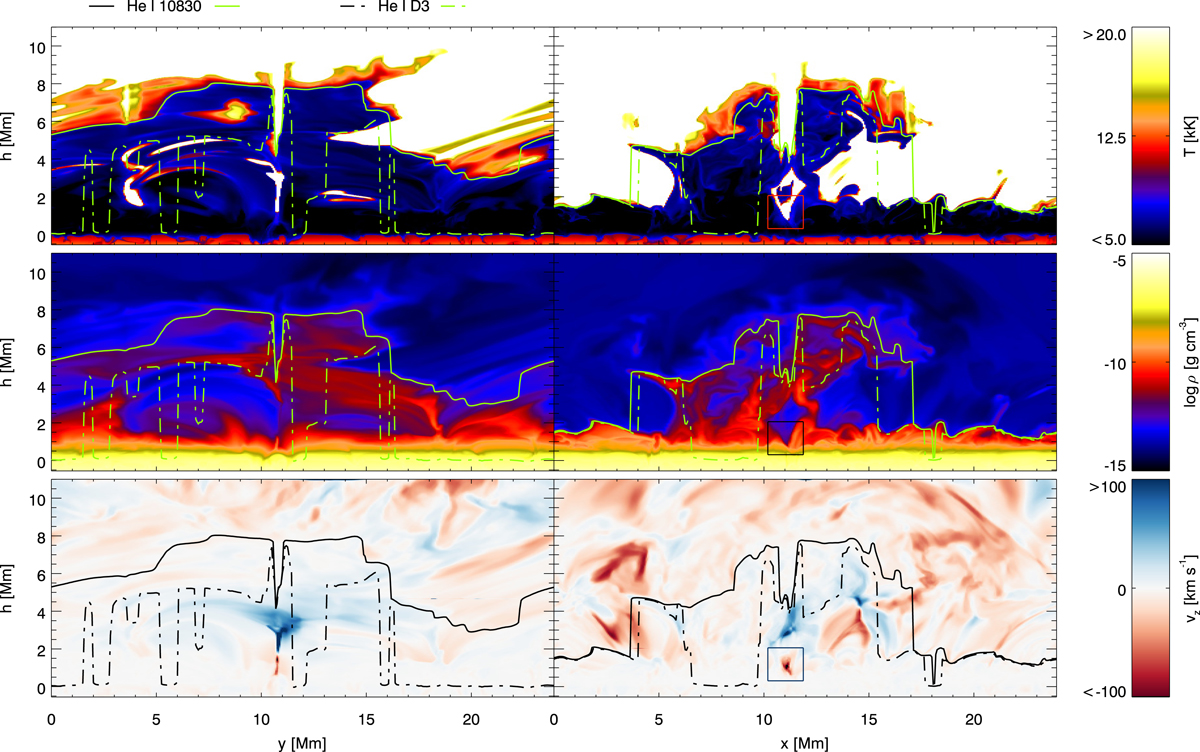
Fig. 1.
Download original image
Vertical cuts through the rMHD snapshot intersecting the EB location at x = 11.3 Mm, y = 10.7 Mm. Left column: cut along the y-axis, and right column: cut along the x-axis. We display the temperature, density (on a logarithmic scale), and the vertical velocity together with hmax, 10 830 (solid line) and hmax, D3 (dash-dotted line) as defined in Eq. (2). The red and black boxes in the right panels indicate the region that we zoom into in Figs. 10, 11, and 13.
Current usage metrics show cumulative count of Article Views (full-text article views including HTML views, PDF and ePub downloads, according to the available data) and Abstracts Views on Vision4Press platform.
Data correspond to usage on the plateform after 2015. The current usage metrics is available 48-96 hours after online publication and is updated daily on week days.
Initial download of the metrics may take a while.