Fig. 9
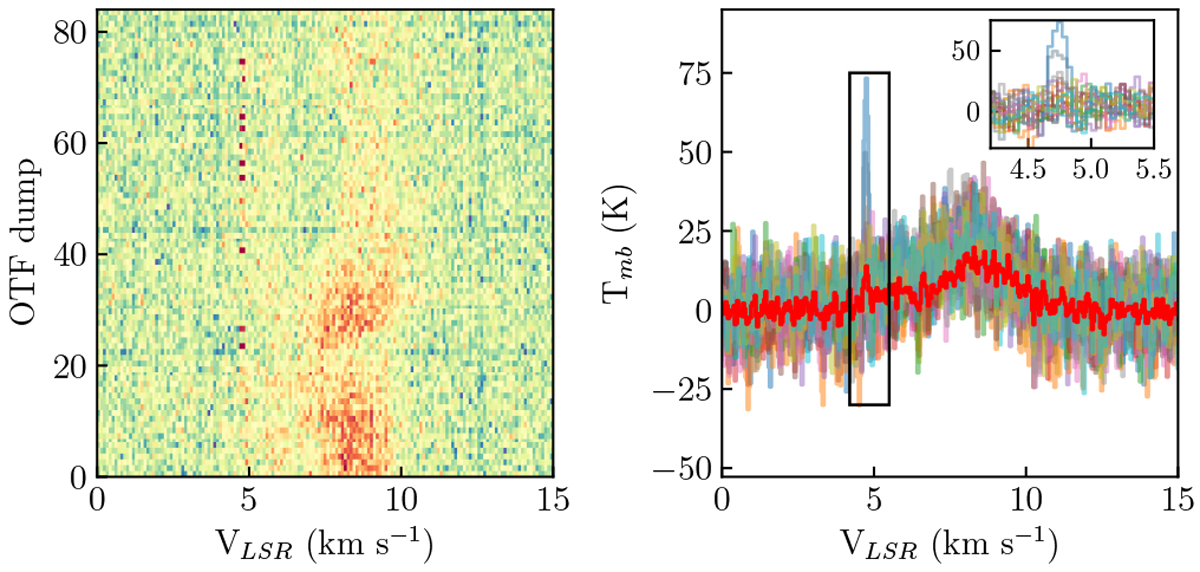
Example interference from a cellphone during the flight of February 9th 2017. Left panel: example of 84 dump OTF scans showing RFI (red dots) at 4.75 km s−1. Line emission is seen centered around 9 km s−1. Right panel: example spectra showing RFI effects at 4.75 km s−1. Right inset:zoom on the RFI emission. The emission extends over several channels and has a maximum peak of 75 Kelvin.
Current usage metrics show cumulative count of Article Views (full-text article views including HTML views, PDF and ePub downloads, according to the available data) and Abstracts Views on Vision4Press platform.
Data correspond to usage on the plateform after 2015. The current usage metrics is available 48-96 hours after online publication and is updated daily on week days.
Initial download of the metrics may take a while.