Fig. 8
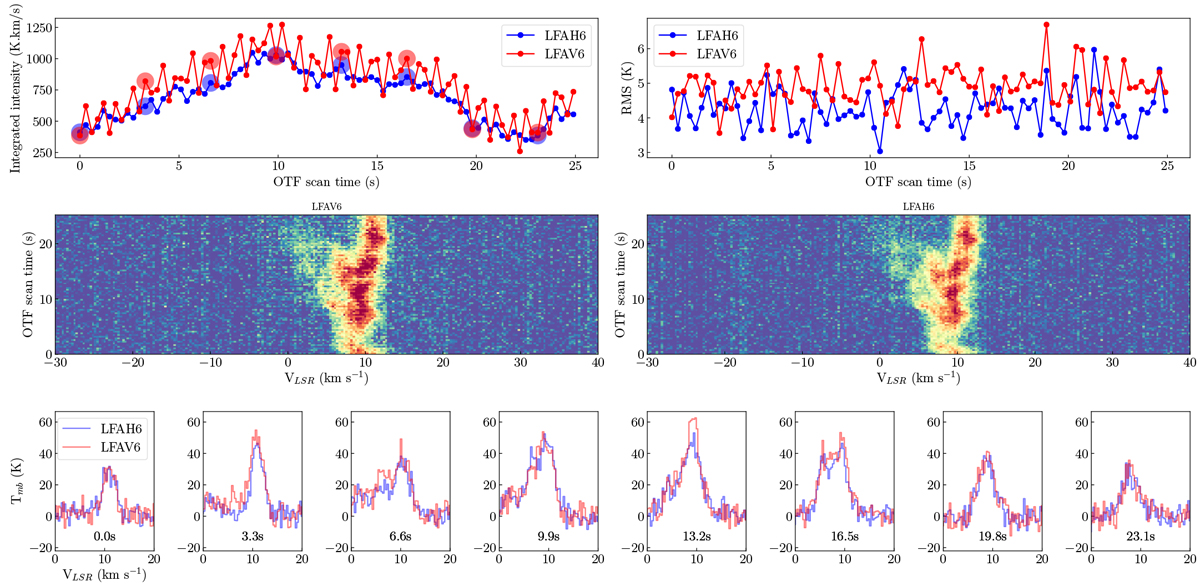
Example of gain instability seen in pixel LFAH6 for a single OTF scan. Top left panel: integrated line intensity between 0 and 15 km s−1 vs. OTF dump time. Top right panel: RMS over a velocity range from 30–40 km s−1. Center panel: map of 84 spectra associated with a single OTF scan. LFAV6 is shown on the left, and LFAH6 is shown on the right. The noisy behavior between adjacent dumps is associated with the V pixel that is not seen in the H pixel. Bottom panel: eight example spectra associated with the solid circles shown in the top left panel.
Current usage metrics show cumulative count of Article Views (full-text article views including HTML views, PDF and ePub downloads, according to the available data) and Abstracts Views on Vision4Press platform.
Data correspond to usage on the plateform after 2015. The current usage metrics is available 48-96 hours after online publication and is updated daily on week days.
Initial download of the metrics may take a while.