Fig. 7
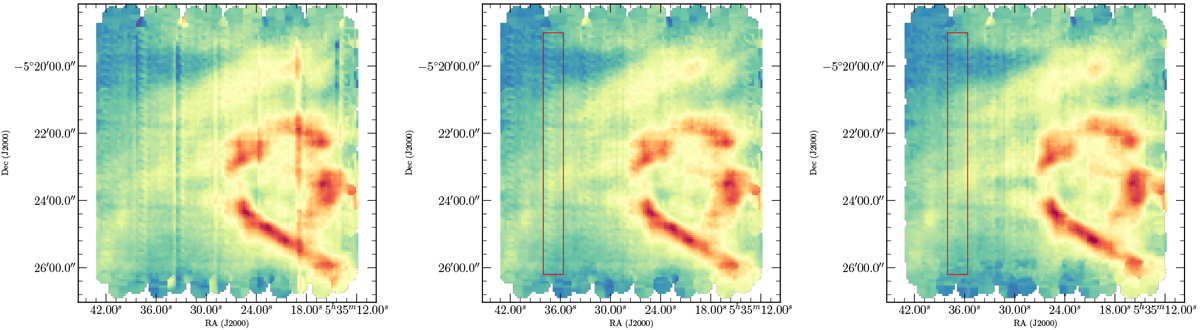
Left panel: integrated intensity between −5 and 15 km s−1 for the center tile using a polynomial order 3 correction. Center panel: same tile, using a spline correction approach. Right panel: using a spline approach and filtering pixels with gain instabilities. The red box in the center and right panels highlights a region of gain instability that is detected as a zipper-like artifact in the map. This is only apparent after the spline baseline correction (for more details, see Sect. 3.3).
Current usage metrics show cumulative count of Article Views (full-text article views including HTML views, PDF and ePub downloads, according to the available data) and Abstracts Views on Vision4Press platform.
Data correspond to usage on the plateform after 2015. The current usage metrics is available 48-96 hours after online publication and is updated daily on week days.
Initial download of the metrics may take a while.