Fig. 6
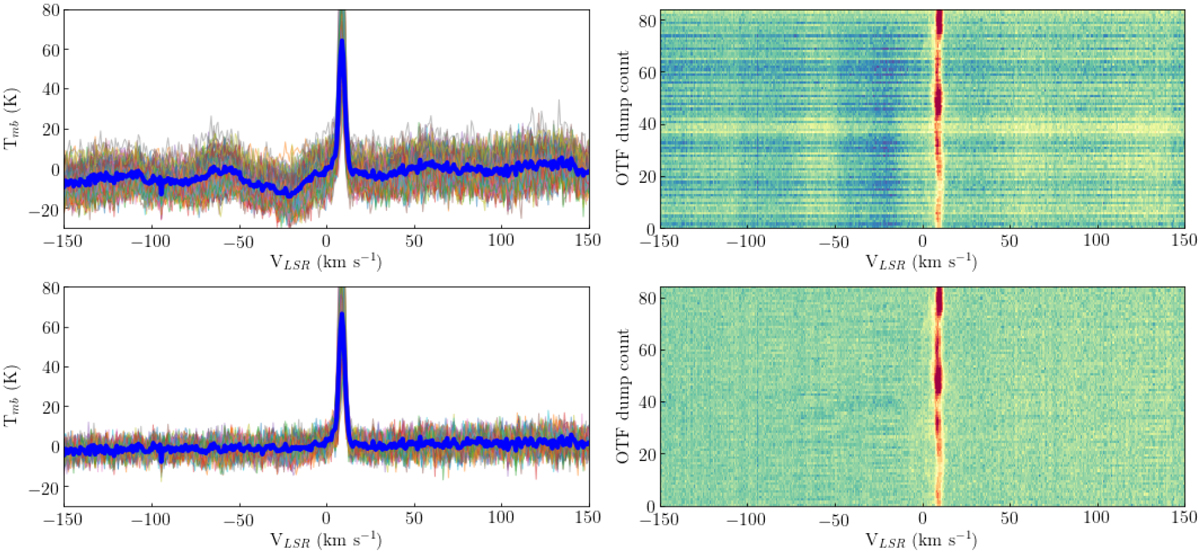
Example spline baseline correction for a typical OTF scan of 84 dumps length. Top left panel: baseline after standard polynomial order 3 baseline correction. The average over 84 dumps is shown in dark blue. Top right panel: waterfall plot of 84 spectra taken during an OTF scan. The dip at −25 km s−1 is common to all spectra. Bottom left panel: baseline after spline correction. The corresponding waterfall plot is shown on the right side. Bottom right panel: waterfall map of 84 spectra after spline correction.
Current usage metrics show cumulative count of Article Views (full-text article views including HTML views, PDF and ePub downloads, according to the available data) and Abstracts Views on Vision4Press platform.
Data correspond to usage on the plateform after 2015. The current usage metrics is available 48-96 hours after online publication and is updated daily on week days.
Initial download of the metrics may take a while.