Fig. 5
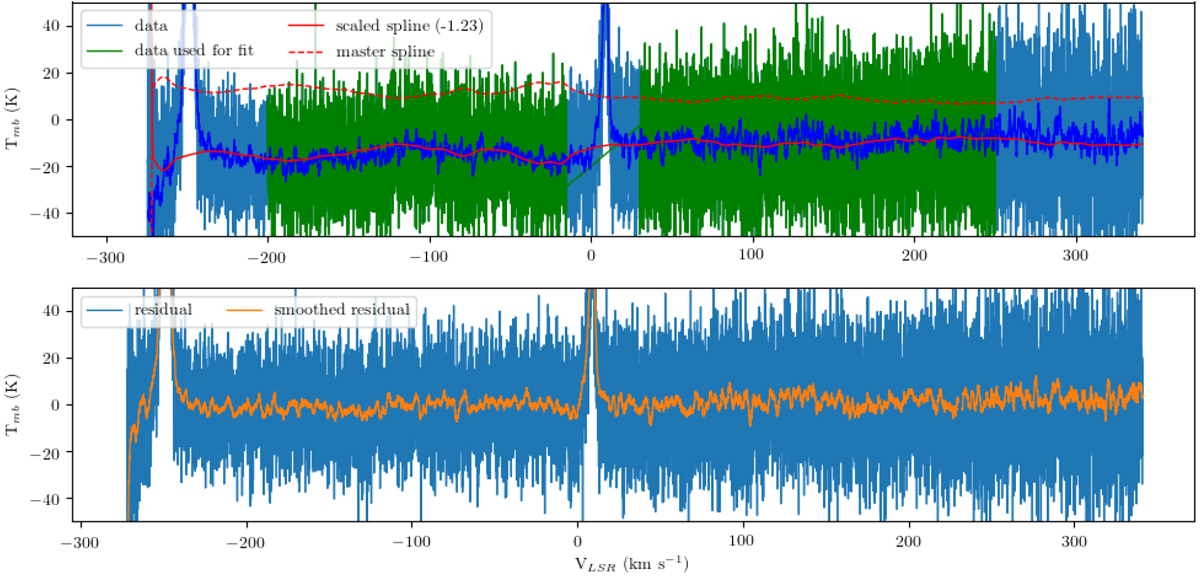
Example of the spline baseline correction process. The dashed red line shows the master spline generated from the residual of two OFF sky measurements. The solid red line shows a scaled version of the master spline that matches the smoothed sky data best (dark blue). The green region shows the channel range over which the spline is fitted. Lower panel: residual of the spline correction. Light blue shows the original data resolution, and orange shows a smoothed version of the corrected data.
Current usage metrics show cumulative count of Article Views (full-text article views including HTML views, PDF and ePub downloads, according to the available data) and Abstracts Views on Vision4Press platform.
Data correspond to usage on the plateform after 2015. The current usage metrics is available 48-96 hours after online publication and is updated daily on week days.
Initial download of the metrics may take a while.