Fig. A.13
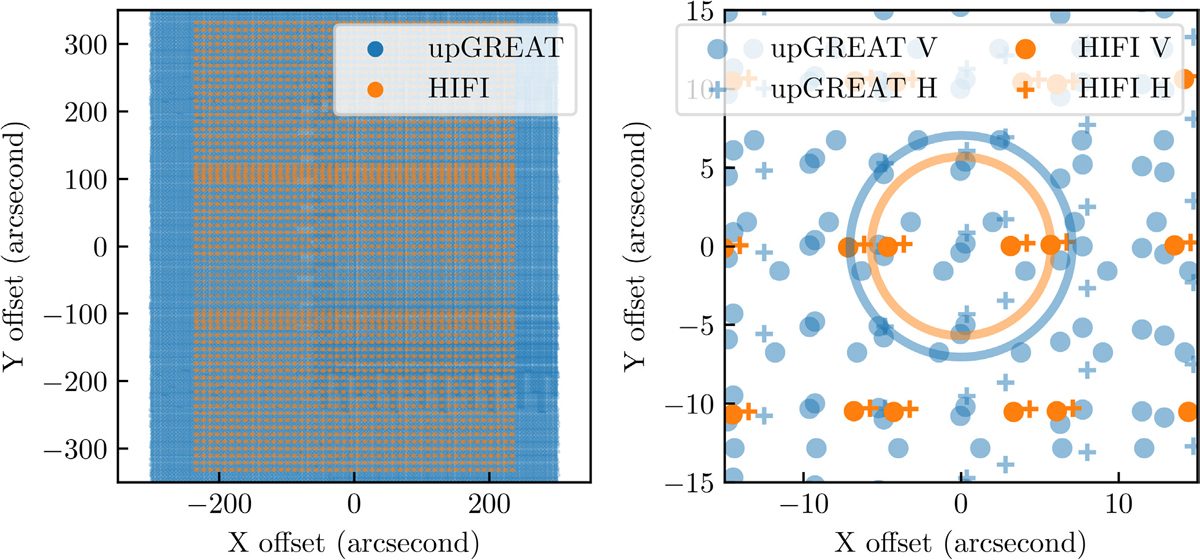
Left panel: overview of spectrum positions for HIFI and upGREAT maps. Right panel: zoom into the central map region. The sparse sampling of the HIFI map with 11-arcsecond spacing between OTF scans arises because half the OTF scan is spent observing the internal cold load andthere are gaps in coverage in the scan direction. HIFI observed in a ABBA format, so that we see two ON spectra taken in succession, followed by two load observations. HIFI and upGREAT beam size are overplotted for comparison at 11.4 and 14.1 arcseconds, respectively.
Current usage metrics show cumulative count of Article Views (full-text article views including HTML views, PDF and ePub downloads, according to the available data) and Abstracts Views on Vision4Press platform.
Data correspond to usage on the plateform after 2015. The current usage metrics is available 48-96 hours after online publication and is updated daily on week days.
Initial download of the metrics may take a while.