Fig. 3
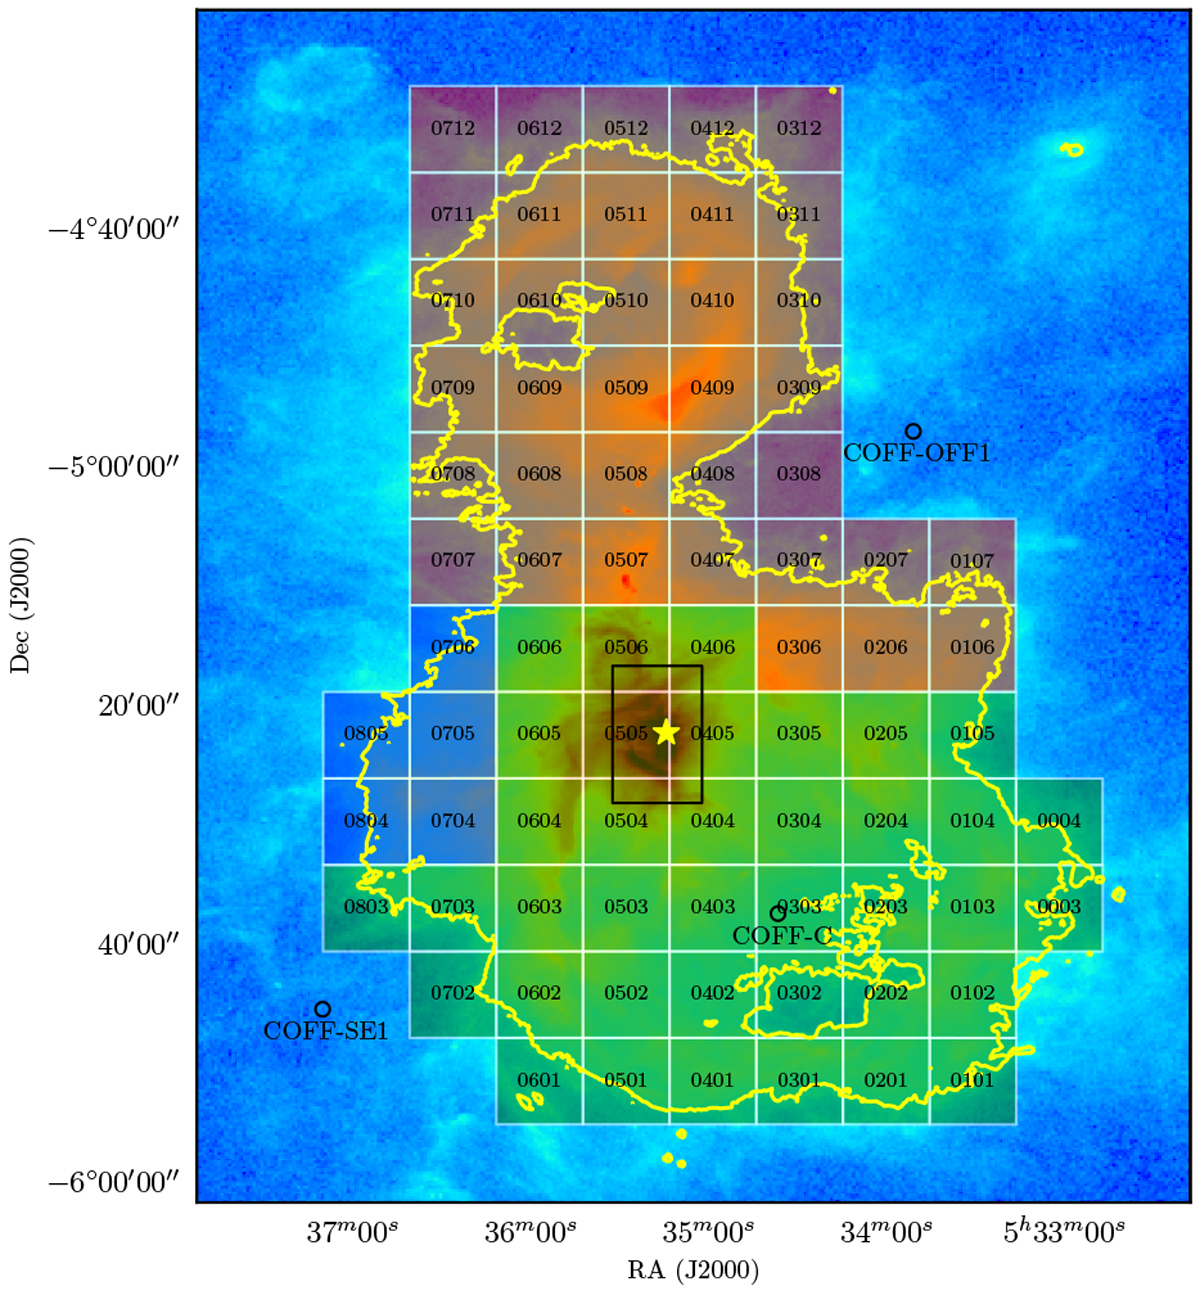
Overview of 78 tiles and their associated OFF positions. Green tiles are associated with the OFF position COFF-C, blue tiles with COFF-SE1, and red tiles with COFF-OFF1. The background image is a 70 micron from Herschel/PACS. The yellow contour denotes regions at a G0 of 50 Habing. The HIFI CII map is highlighted with the black box at the center of the map (Goicoechea et al. 2015). The Orion KL outflow is marked with a yellow star.
Current usage metrics show cumulative count of Article Views (full-text article views including HTML views, PDF and ePub downloads, according to the available data) and Abstracts Views on Vision4Press platform.
Data correspond to usage on the plateform after 2015. The current usage metrics is available 48-96 hours after online publication and is updated daily on week days.
Initial download of the metrics may take a while.