Free Access
Fig. A.7
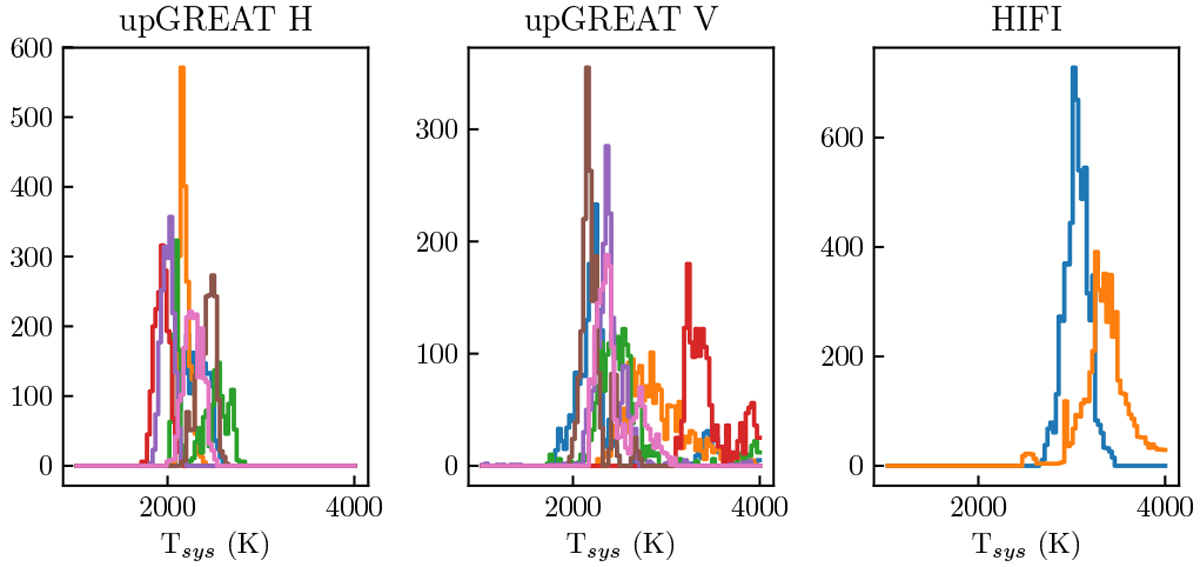
Distribution of single-sideband system temperature for each pixel in all 13 flights with a comparison to HIFI system temperatures for the Orion map. The receiver temperatures are measured in the IF band where the astronomical signal falls. In the case of upGREAT, this is at an IF of 1.9 GHz (see Fig. A.8).
Current usage metrics show cumulative count of Article Views (full-text article views including HTML views, PDF and ePub downloads, according to the available data) and Abstracts Views on Vision4Press platform.
Data correspond to usage on the plateform after 2015. The current usage metrics is available 48-96 hours after online publication and is updated daily on week days.
Initial download of the metrics may take a while.