Fig. A.5
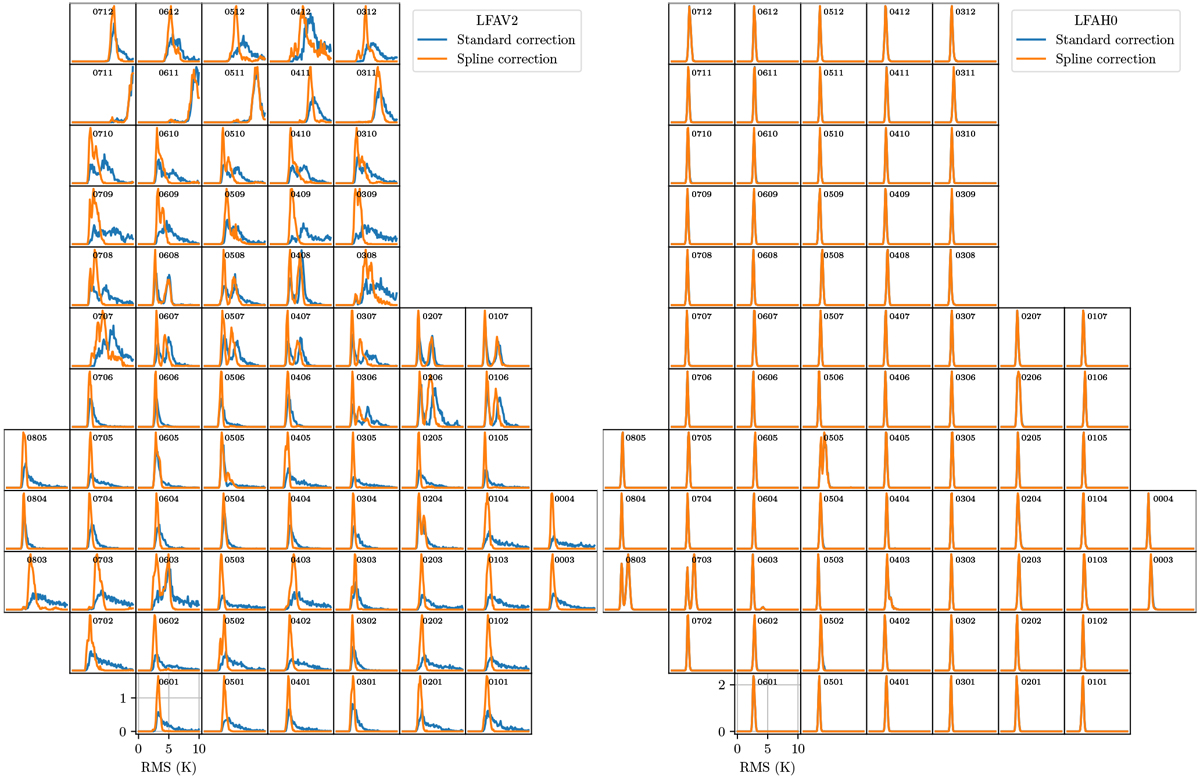
RMS distribution for all spectra for pixel LFAV2 (left panel) and LFAH0 (right panel) per map tile. The RMS distribution is shown before (blue) and after baseline spline correction (orange). Baseline issues in the RMS distribution are shown by a long tail toward higher RMS values. Pixel LFAV2 shows a noticeable improvement in RMS distribution compared to the standard polynomial baseline correction. Conversely, LFAH0 has no baseline performance issue, and so the application of the spline correction made no significant difference to the RMS distribution. The RMS is taken over a range of −100 to 100 km s−1 in which the central region from −20 to 30 km s−1 was ignored for the RMS determination. The spectra have a 0.2 km s−1 resolution.
Current usage metrics show cumulative count of Article Views (full-text article views including HTML views, PDF and ePub downloads, according to the available data) and Abstracts Views on Vision4Press platform.
Data correspond to usage on the plateform after 2015. The current usage metrics is available 48-96 hours after online publication and is updated daily on week days.
Initial download of the metrics may take a while.