Fig. A.4
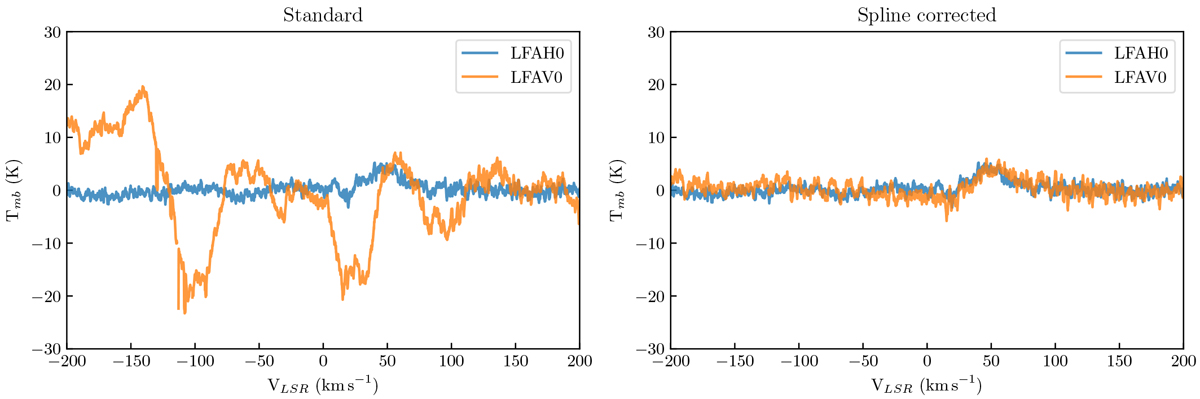
Before and after spline correction. Average of 80 spectra from an OTF scan taken as part of the [CII] Galactic center mapping project (data shown in Fig. A.3 are part of this average). Left panel: standard reduction with a third-order polynomial baseline correction. Right panel: Reduction using the spline catalog approach. We note [CII] emission from 20 to 70 km s−1 and consistent line emission seen between coaligned (~2 arcseconds) H and V pixels after correction.
Current usage metrics show cumulative count of Article Views (full-text article views including HTML views, PDF and ePub downloads, according to the available data) and Abstracts Views on Vision4Press platform.
Data correspond to usage on the plateform after 2015. The current usage metrics is available 48-96 hours after online publication and is updated daily on week days.
Initial download of the metrics may take a while.