Fig. A.1
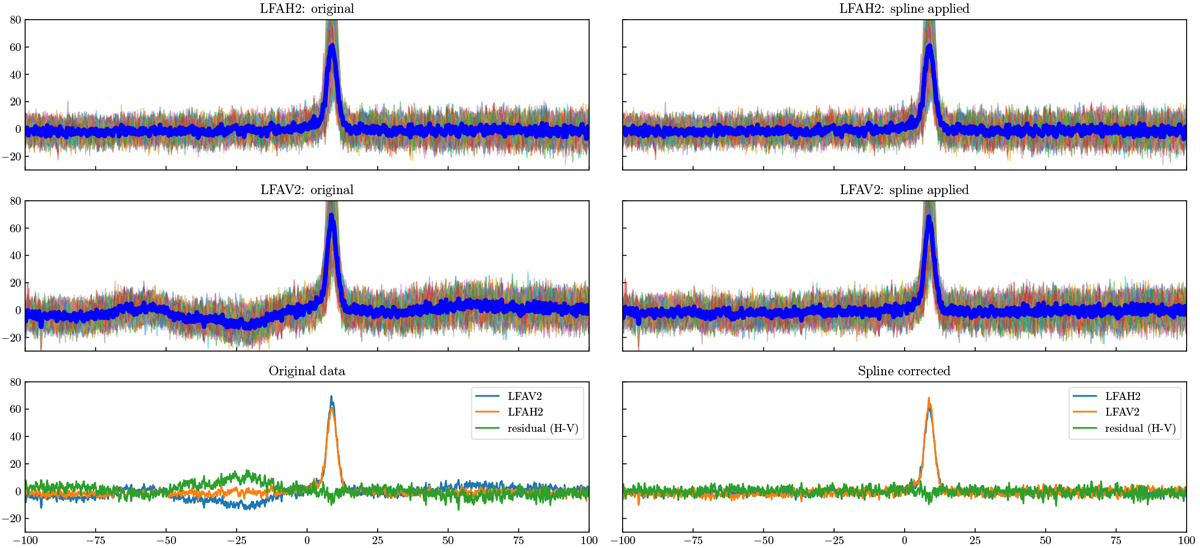
Comparison of the LFAH2 (left panels) and LFAV2 (right panels) pixels with and without spline baseline correction. Dark blue lines show the average spectrum over 84 spectra. Lower panels: residual between the H and V data with and without spline correction. There is a 5 kelvin difference between the peak intensity before and after spline correction, indicating that spline correction has not affected the line intensity. LFAH2 and LFAV2 are not coaligned and are offset onthe sky by 2 arcseconds, which might account for the different line intensity.
Current usage metrics show cumulative count of Article Views (full-text article views including HTML views, PDF and ePub downloads, according to the available data) and Abstracts Views on Vision4Press platform.
Data correspond to usage on the plateform after 2015. The current usage metrics is available 48-96 hours after online publication and is updated daily on week days.
Initial download of the metrics may take a while.