Fig. 19
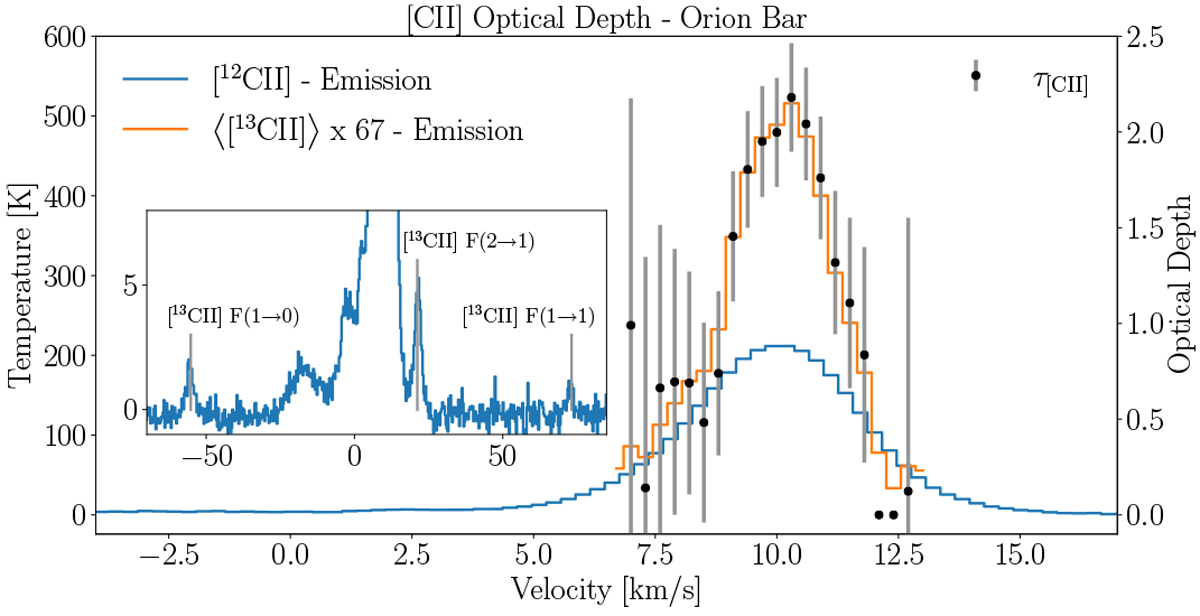
Averaged [12CII] and [13CII] emission originating from the ridge of the Orion bar. The blue spectrum shows the [12 CII] line, and the orange spectrum shows the velocity-corrected [13CII] emission averaged over the three hyperfine components and multiplied by 67, the carbon isotopic ratio in Orion (Langer & Penzias 1990). The black data points with error bars show the determined optical depth for each velocity channel, which is above unity around the peak of the line [12 CII]. The inner panel shows the three [13CII] hyperfine transitions lines detected alongside the [12CII] line.
Current usage metrics show cumulative count of Article Views (full-text article views including HTML views, PDF and ePub downloads, according to the available data) and Abstracts Views on Vision4Press platform.
Data correspond to usage on the plateform after 2015. The current usage metrics is available 48-96 hours after online publication and is updated daily on week days.
Initial download of the metrics may take a while.