Fig. 18
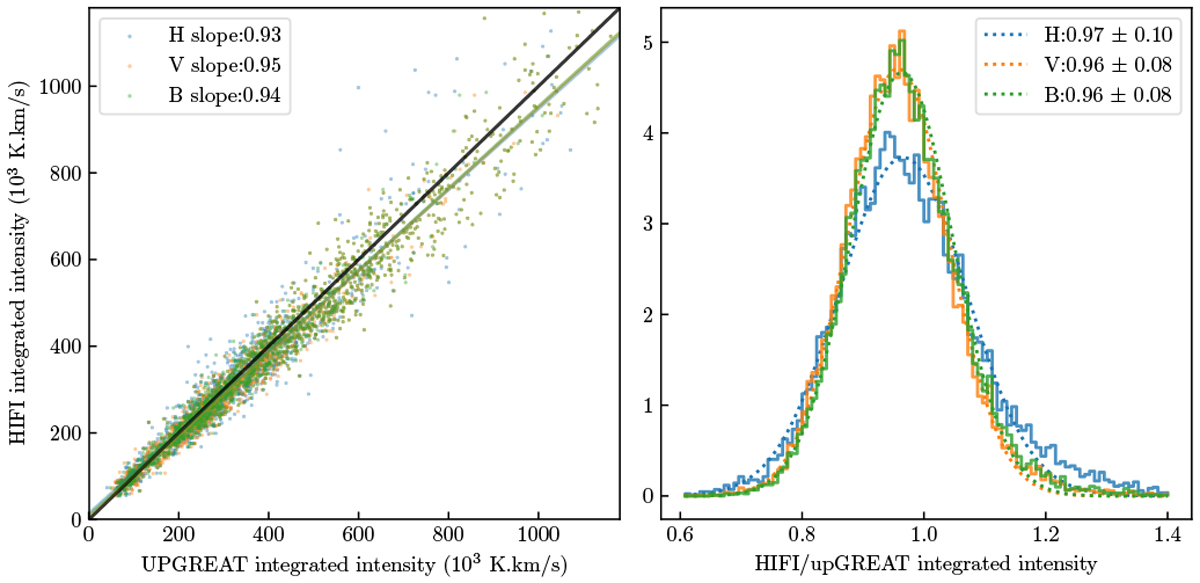
Left panel: integrated intensity from HIFI and upGREAT maps plotted against each other. Three upGREAT maps are shown: separate maps for the H and V polarizations, and a map with both polarizations together. The HIFI map is generated from both polarizations. Right panel: distribution of the HIFI map divided by upGREAT maps with a Gaussian fit. The plot legend shows the fit Gaussian width and offset.
Current usage metrics show cumulative count of Article Views (full-text article views including HTML views, PDF and ePub downloads, according to the available data) and Abstracts Views on Vision4Press platform.
Data correspond to usage on the plateform after 2015. The current usage metrics is available 48-96 hours after online publication and is updated daily on week days.
Initial download of the metrics may take a while.