Fig. 17
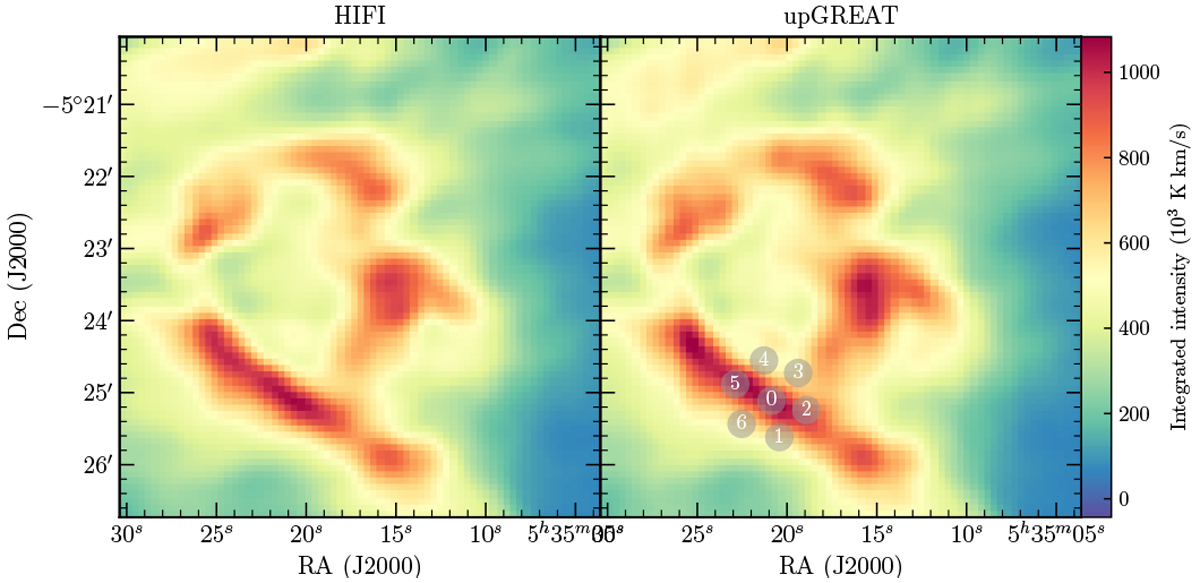
Side-by-side plot of HIFI and upGREAT data. Both maps are generated with a 22 arcsecond mapping kernel, and both datasets are in main-beam antenna temperature. The integrated intensity between −5 and 15 km s−1 is shown. The array positions highlighted in gray show the location of the Orion bar consistency observation discussed in Sect. 4.1.
Current usage metrics show cumulative count of Article Views (full-text article views including HTML views, PDF and ePub downloads, according to the available data) and Abstracts Views on Vision4Press platform.
Data correspond to usage on the plateform after 2015. The current usage metrics is available 48-96 hours after online publication and is updated daily on week days.
Initial download of the metrics may take a while.