Fig. 12
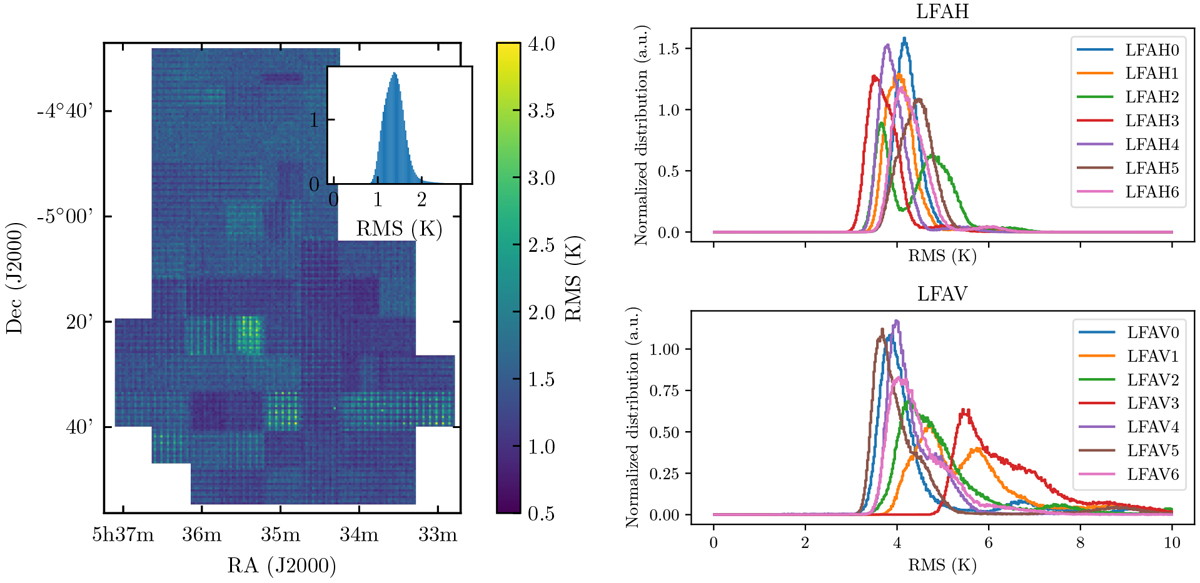
Left panel: distribution of RMS over final map. RMS taken over a line free range from −50 to −20 km s−1 with a 0.3 km s−1 spectral resolution. Left inset panel: RMS map shows a histogram of the distribution of RMS over the entire map with a peak value of 1.63K. Right panel: distribution of spectrum RMS before map generation with a 0.3 km s−1 spectral resolution. Some pixels have two peaks (V1 and H2) or a trailing tail (V3) in their distribution, indicating a change in RMS performance over the two flight series.
Current usage metrics show cumulative count of Article Views (full-text article views including HTML views, PDF and ePub downloads, according to the available data) and Abstracts Views on Vision4Press platform.
Data correspond to usage on the plateform after 2015. The current usage metrics is available 48-96 hours after online publication and is updated daily on week days.
Initial download of the metrics may take a while.