Free Access
Fig. 10
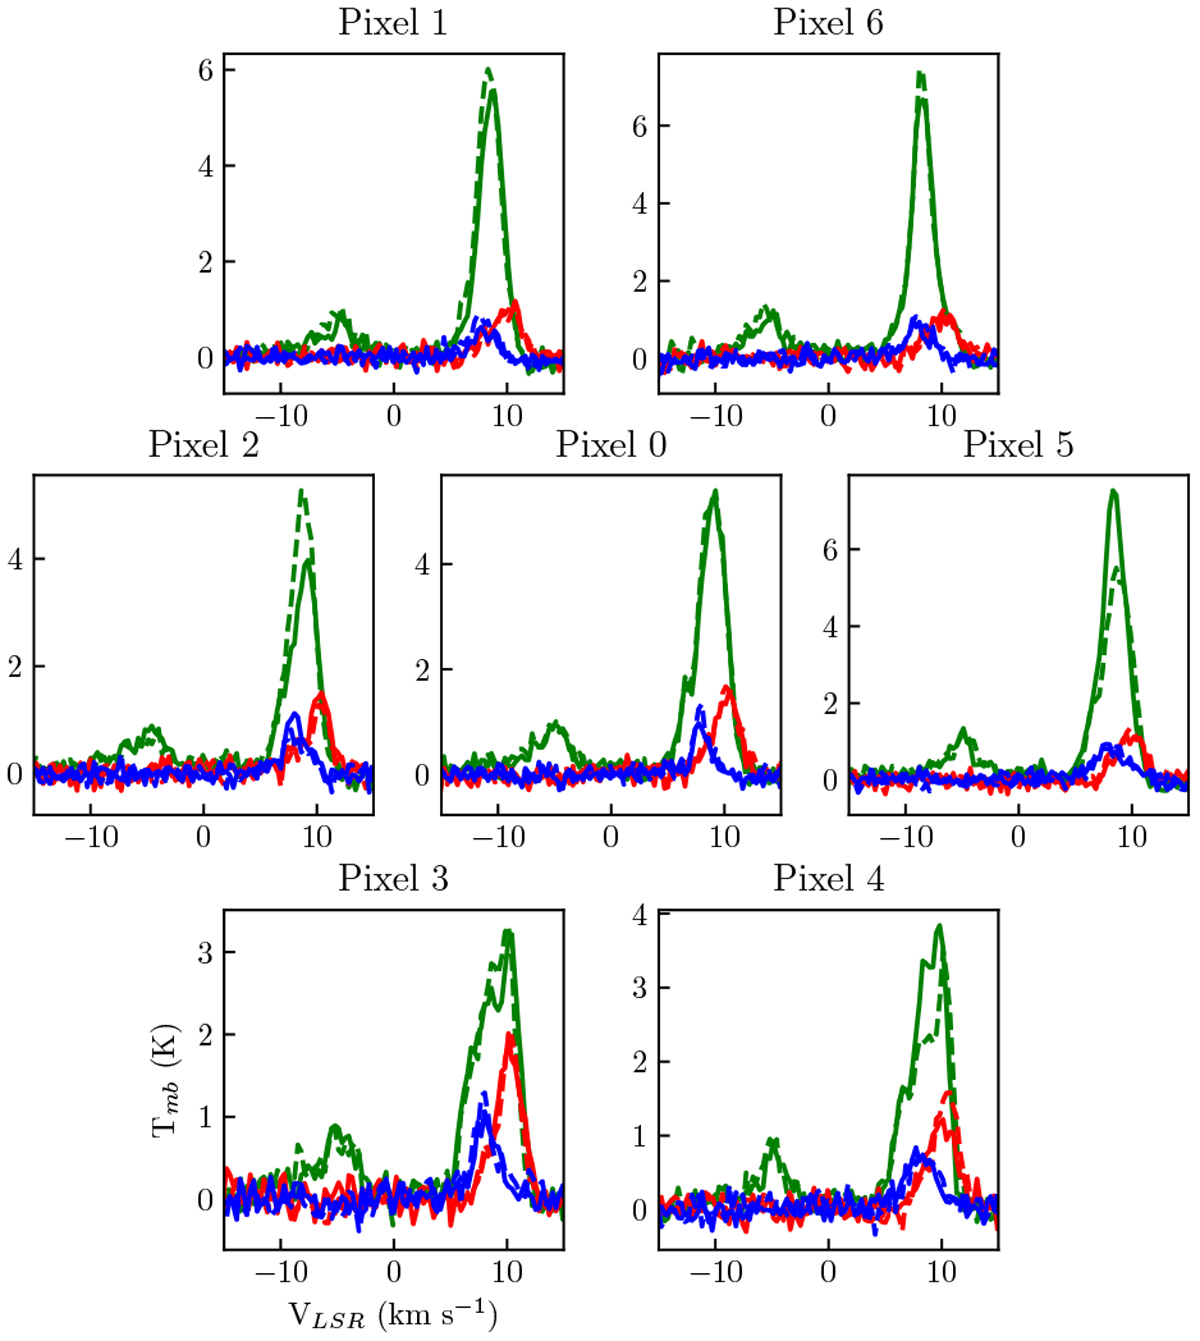
Overview of emission from the three OFF positions for H-array pixels. Each position is observed at the X and Y scan direction orientation (Y is shown as the dashed line in the plot). The colors correspond to the color shown in the tile overview in Fig. 3 (blue shows COFF-SE1, green shows COFF-C, and red shows COFF-OFF1).
Current usage metrics show cumulative count of Article Views (full-text article views including HTML views, PDF and ePub downloads, according to the available data) and Abstracts Views on Vision4Press platform.
Data correspond to usage on the plateform after 2015. The current usage metrics is available 48-96 hours after online publication and is updated daily on week days.
Initial download of the metrics may take a while.