Fig. 1
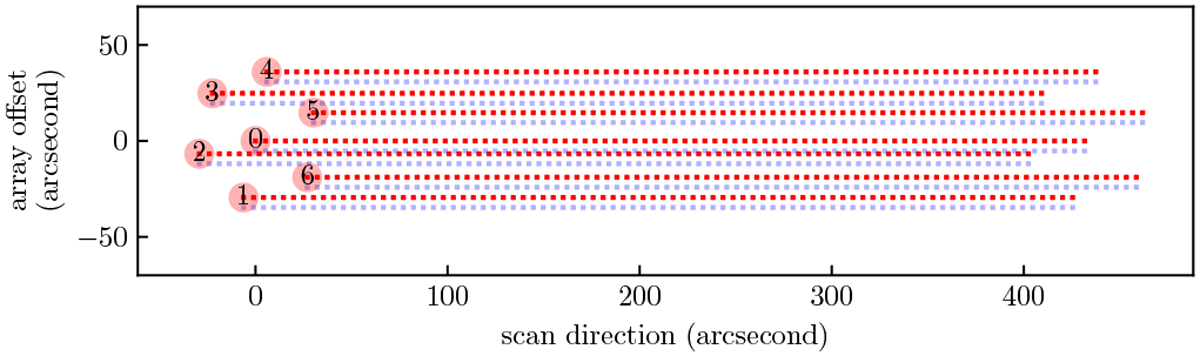
Overview of the upGREAT array pixel layout and an array OTF scan pattern. Red circles show the upGREAT beam size of 14.1 arcseconds rotated to the 19.1° array angle,which gives an equidistant spacing orthogonal to the scan direction between the tracks of the individual pixels along the scan direction. The dashed red line shows a typical 84 dump OTF scan, and the dashed blue line shows the subsequent scan offset at 5.2 arcseconds. The pixel positions are actual sky positions from an imperfect alignment, which causes the larger vertical gap between pixel 0 and 5 compared to pixel 0 and 2.
Current usage metrics show cumulative count of Article Views (full-text article views including HTML views, PDF and ePub downloads, according to the available data) and Abstracts Views on Vision4Press platform.
Data correspond to usage on the plateform after 2015. The current usage metrics is available 48-96 hours after online publication and is updated daily on week days.
Initial download of the metrics may take a while.