Fig. 3
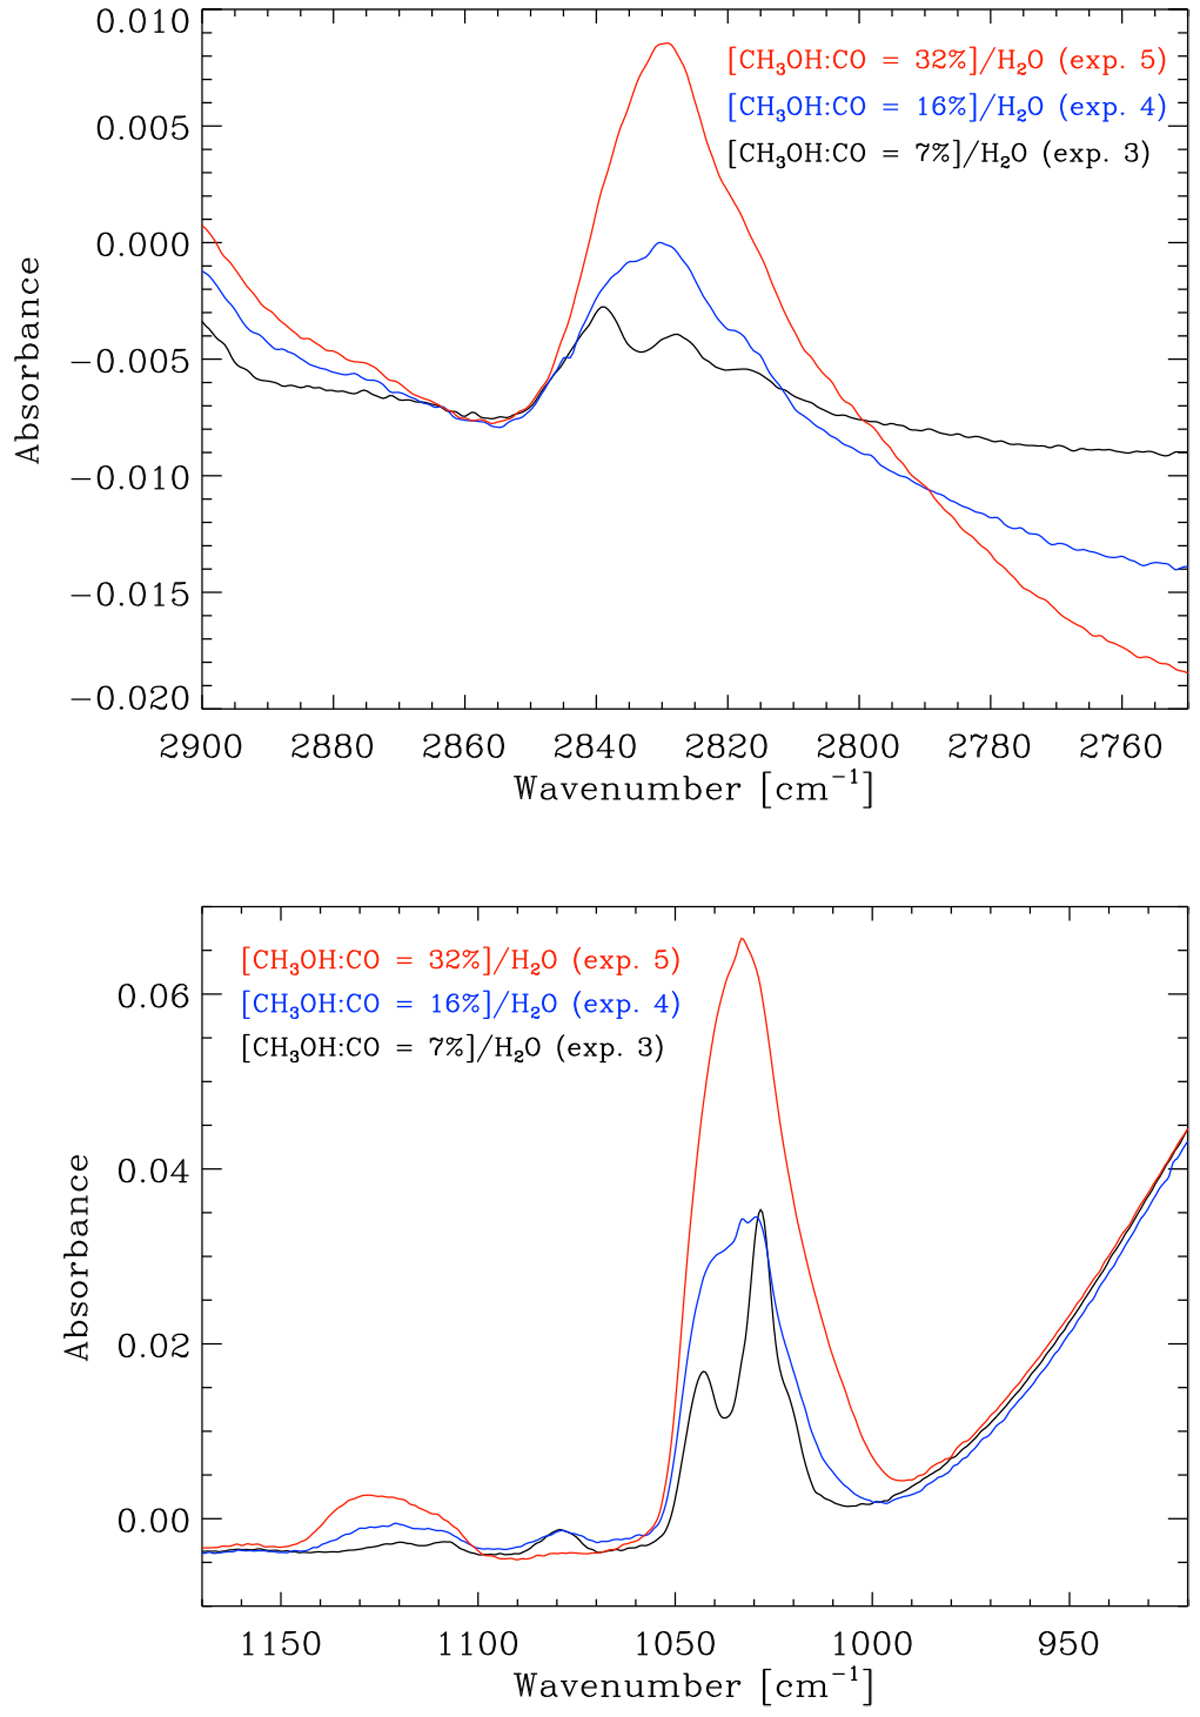
Spectra of methanol in CO mixture layered on top of water ice, zoomed-in on the 3.54 μm CH-stretch frequency range (top) and zoomed-in on the 9.75 μm CO-stretch frequency range (bottom). The spectra are shown for relative abundances of CH3OH:CO = 7% (exp. 3 in Table 1), CH3OH:CO = 16% (exp. 4 in Table 1), and CH3OH:CO = 31% (exp. 5 in Table 1).
Current usage metrics show cumulative count of Article Views (full-text article views including HTML views, PDF and ePub downloads, according to the available data) and Abstracts Views on Vision4Press platform.
Data correspond to usage on the plateform after 2015. The current usage metrics is available 48-96 hours after online publication and is updated daily on week days.
Initial download of the metrics may take a while.