Fig. 5.
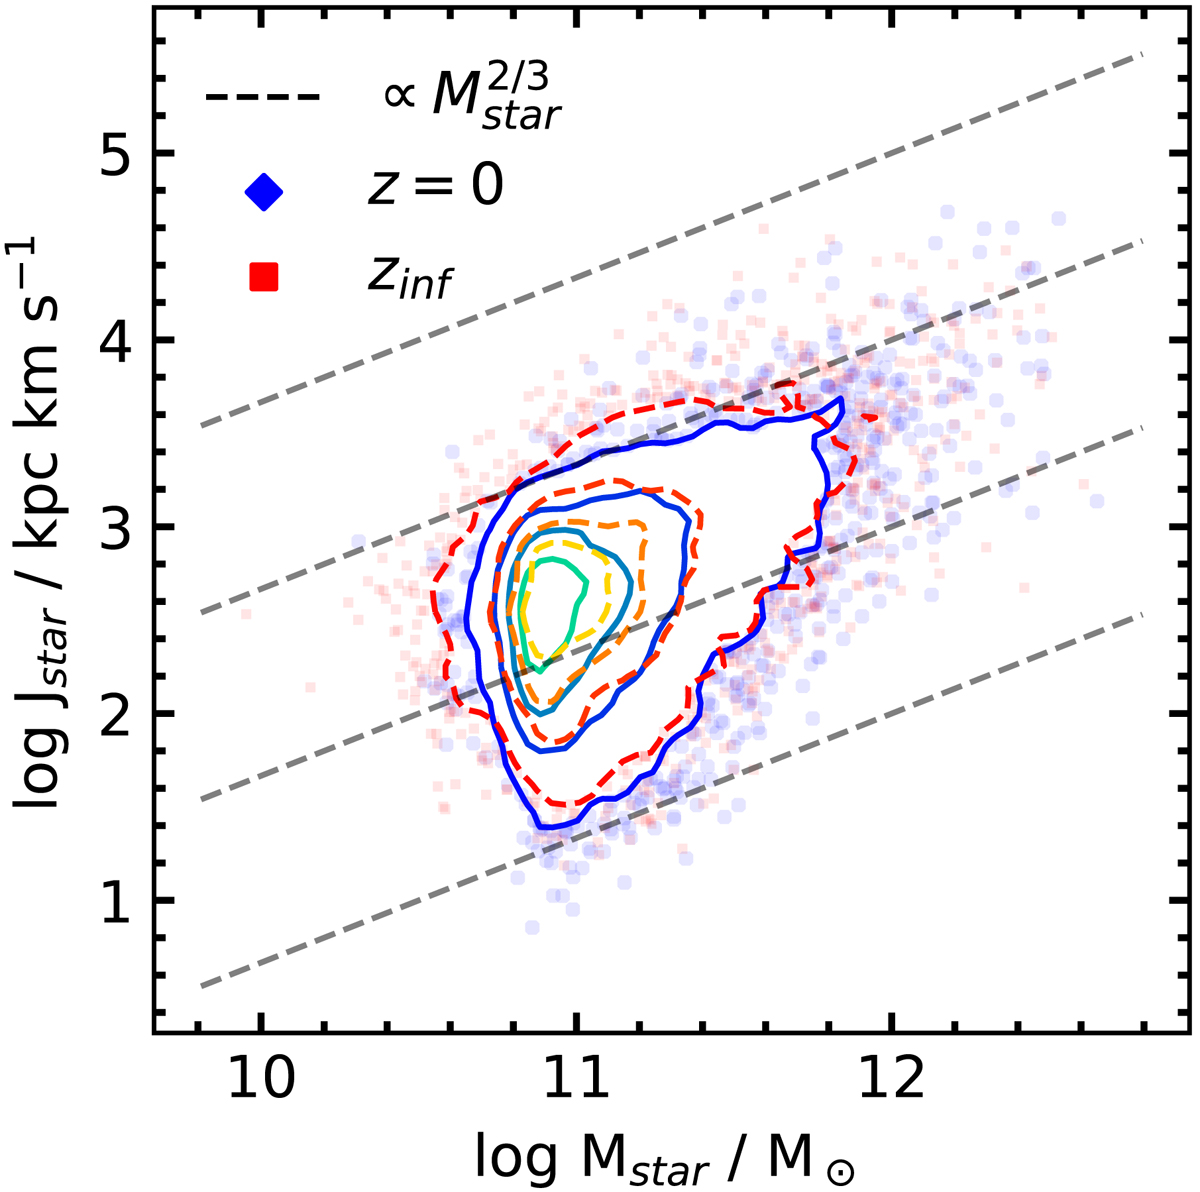
Specific angular momentum and stellar mass relation of the sample of galaxies at z = 0 and at their infall redshift zinf. The diagonal dashed lines show the ![]() relation for zero-points −3 (top line) to −6 (bottom line). The contours show 75, 50, 25, and 5% of the sample. The positions in the plane of objects beyond the 5% contour are shown as filled markers.
relation for zero-points −3 (top line) to −6 (bottom line). The contours show 75, 50, 25, and 5% of the sample. The positions in the plane of objects beyond the 5% contour are shown as filled markers.
Current usage metrics show cumulative count of Article Views (full-text article views including HTML views, PDF and ePub downloads, according to the available data) and Abstracts Views on Vision4Press platform.
Data correspond to usage on the plateform after 2015. The current usage metrics is available 48-96 hours after online publication and is updated daily on week days.
Initial download of the metrics may take a while.