Fig. 3.
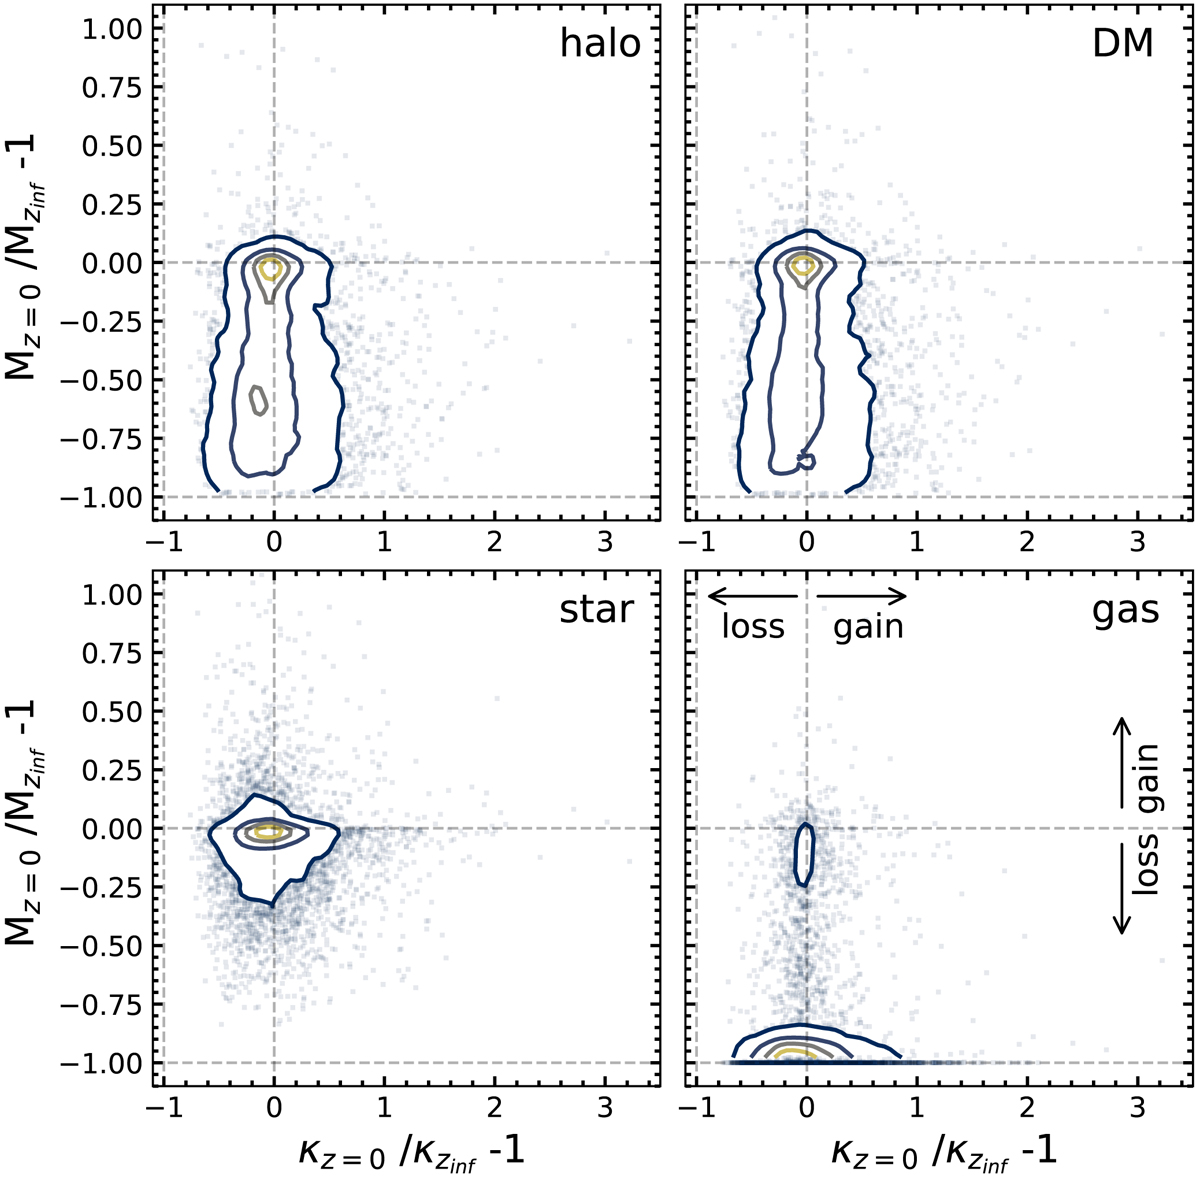
Evolution of the different mass components of the haloes in the sample and their fraction of ordered rotation κ from their infall redshift zinf to their z = 0 values. Contour levels show the 75, 50, 25, and 5% of the maximum counts of the distributions. The horizontal lines at 0 and −1 correspond to no change and maximum mass loss, respectively. The position in the plane of objects beyond the 5% contour are shown as square markers.
Current usage metrics show cumulative count of Article Views (full-text article views including HTML views, PDF and ePub downloads, according to the available data) and Abstracts Views on Vision4Press platform.
Data correspond to usage on the plateform after 2015. The current usage metrics is available 48-96 hours after online publication and is updated daily on week days.
Initial download of the metrics may take a while.