Fig. 2.
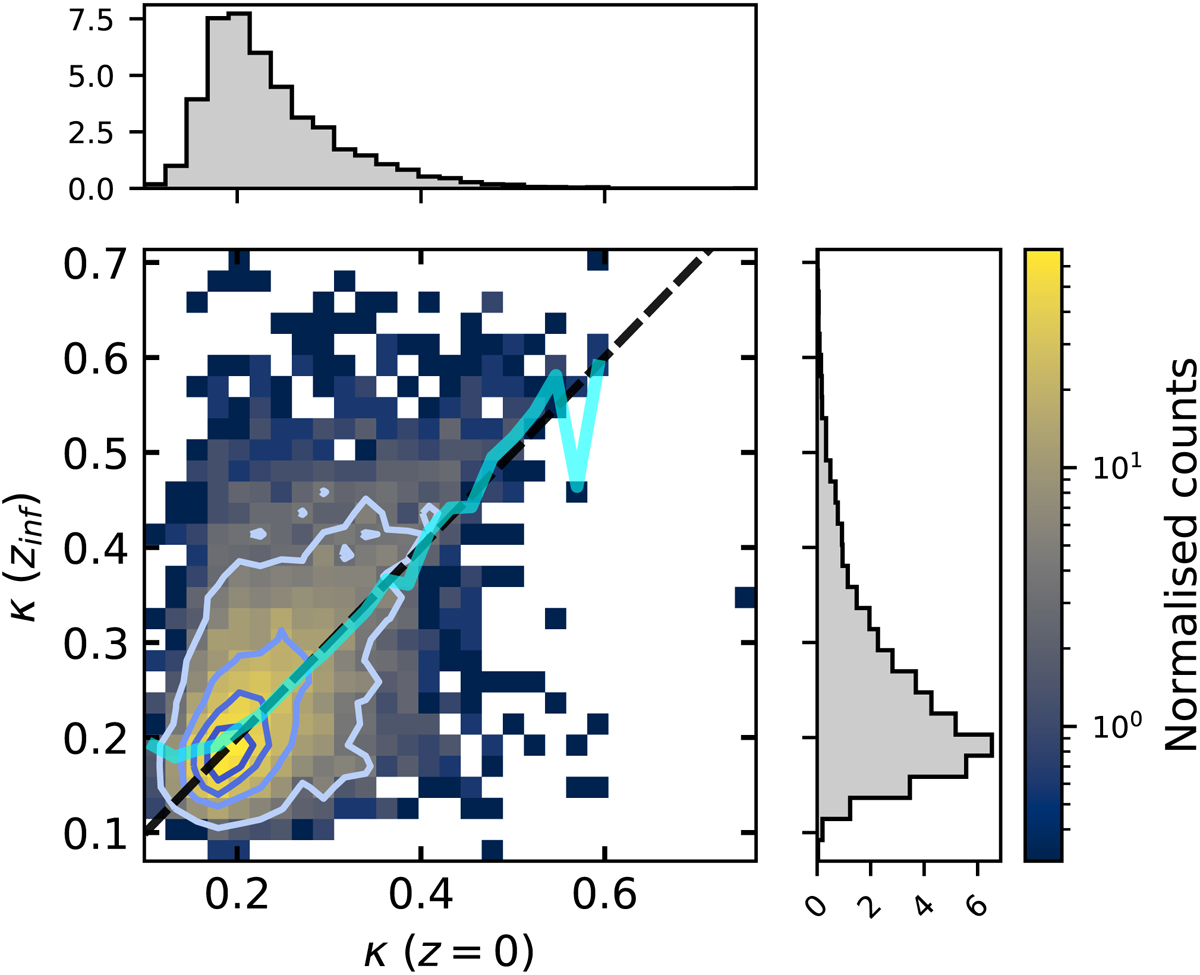
Fraction of ordered rotation κ at z = 0 and at the infall redshift zinf. The diagonal dashed line shows the 1 : 1 relation. Median values in bins of κ(z = 0) for the sample are represented by the solid cyan line. Bins are coloured by their corresponding normalised counts. The contour lines show where 75, 50, 25, and 5% of the maximum counts lie.
Current usage metrics show cumulative count of Article Views (full-text article views including HTML views, PDF and ePub downloads, according to the available data) and Abstracts Views on Vision4Press platform.
Data correspond to usage on the plateform after 2015. The current usage metrics is available 48-96 hours after online publication and is updated daily on week days.
Initial download of the metrics may take a while.