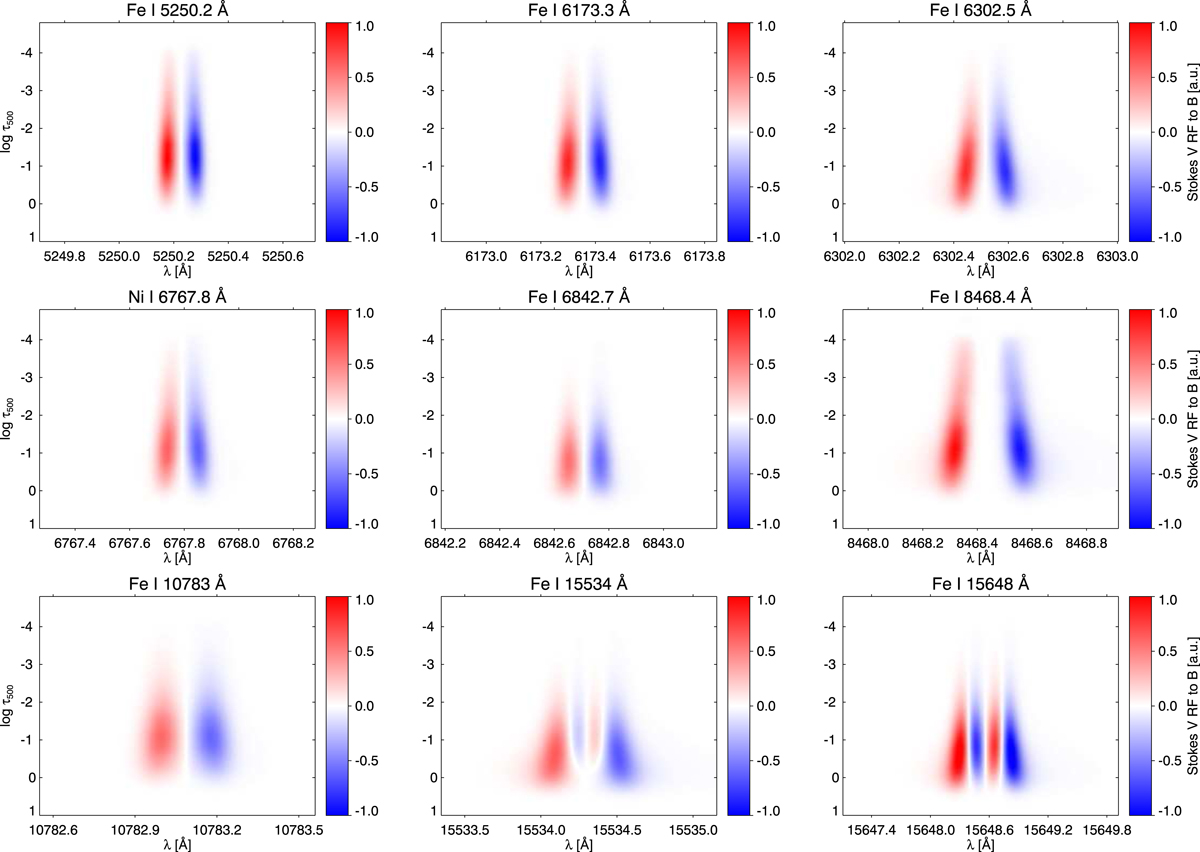
Fig. 4.
Download original image
Two-dimensional plot of the Stokes V RF to changes in the field strength. Each panel displays the results for one of the selected spectral lines. White areas designate regions of no sensitivity to changes in the atmospheric parameters, and red and blue indicate opposite signs of the RF. All panels are normalised to the maximum of the Fe I 5250.2 Å Stokes V RF.
Current usage metrics show cumulative count of Article Views (full-text article views including HTML views, PDF and ePub downloads, according to the available data) and Abstracts Views on Vision4Press platform.
Data correspond to usage on the plateform after 2015. The current usage metrics is available 48-96 hours after online publication and is updated daily on week days.
Initial download of the metrics may take a while.