Open Access
Fig. 9
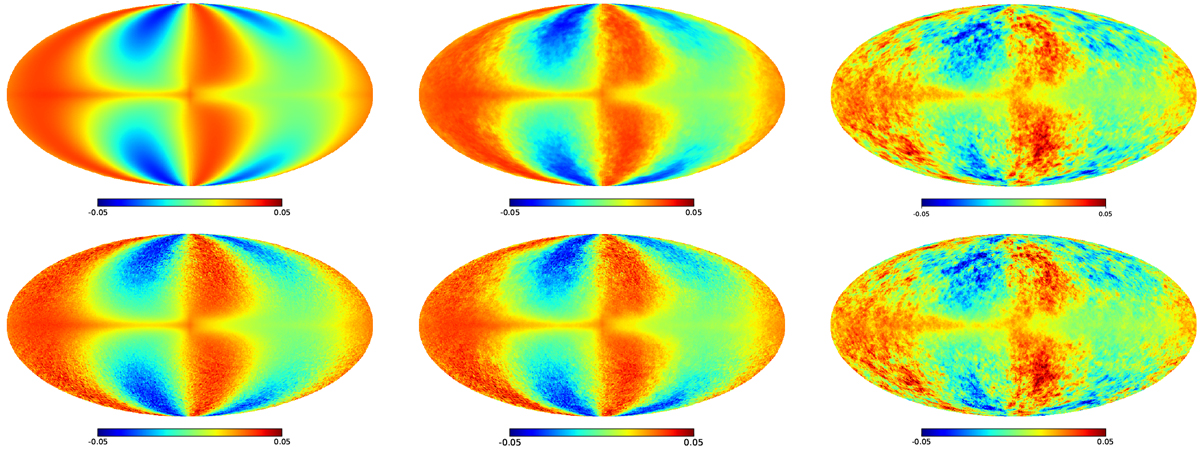
For the S1 simulation, map of the reduced Stokes q downgraded at Nside = 64 for the cases with Aturb = 0.0, Aturb = 0.3 and Aturb = 0.9, from left to right. Top panels results from regular and turbulent field; Planck noise is added in the bottom panels.
Current usage metrics show cumulative count of Article Views (full-text article views including HTML views, PDF and ePub downloads, according to the available data) and Abstracts Views on Vision4Press platform.
Data correspond to usage on the plateform after 2015. The current usage metrics is available 48-96 hours after online publication and is updated daily on week days.
Initial download of the metrics may take a while.