Open Access
Fig. 8
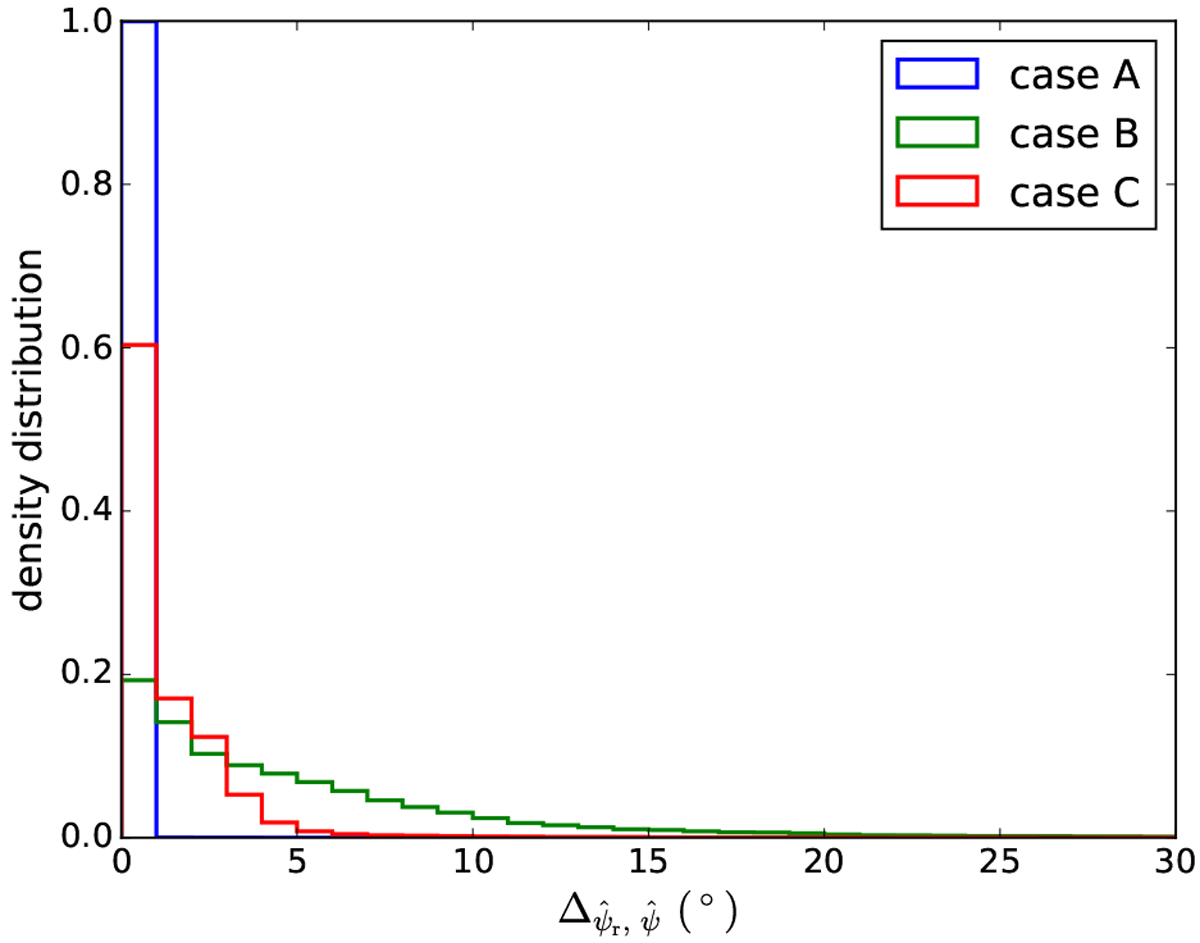
Histogram of the differences of the polarization position angles between the data and the best fits. The polarization position angles are deduced from the q and u maps both from the downgraded simulations (S1 and S2 but without the Planck noise) and from the best-fit maps.
Current usage metrics show cumulative count of Article Views (full-text article views including HTML views, PDF and ePub downloads, according to the available data) and Abstracts Views on Vision4Press platform.
Data correspond to usage on the plateform after 2015. The current usage metrics is available 48-96 hours after online publication and is updated daily on week days.
Initial download of the metrics may take a while.