Open Access
Fig. 6
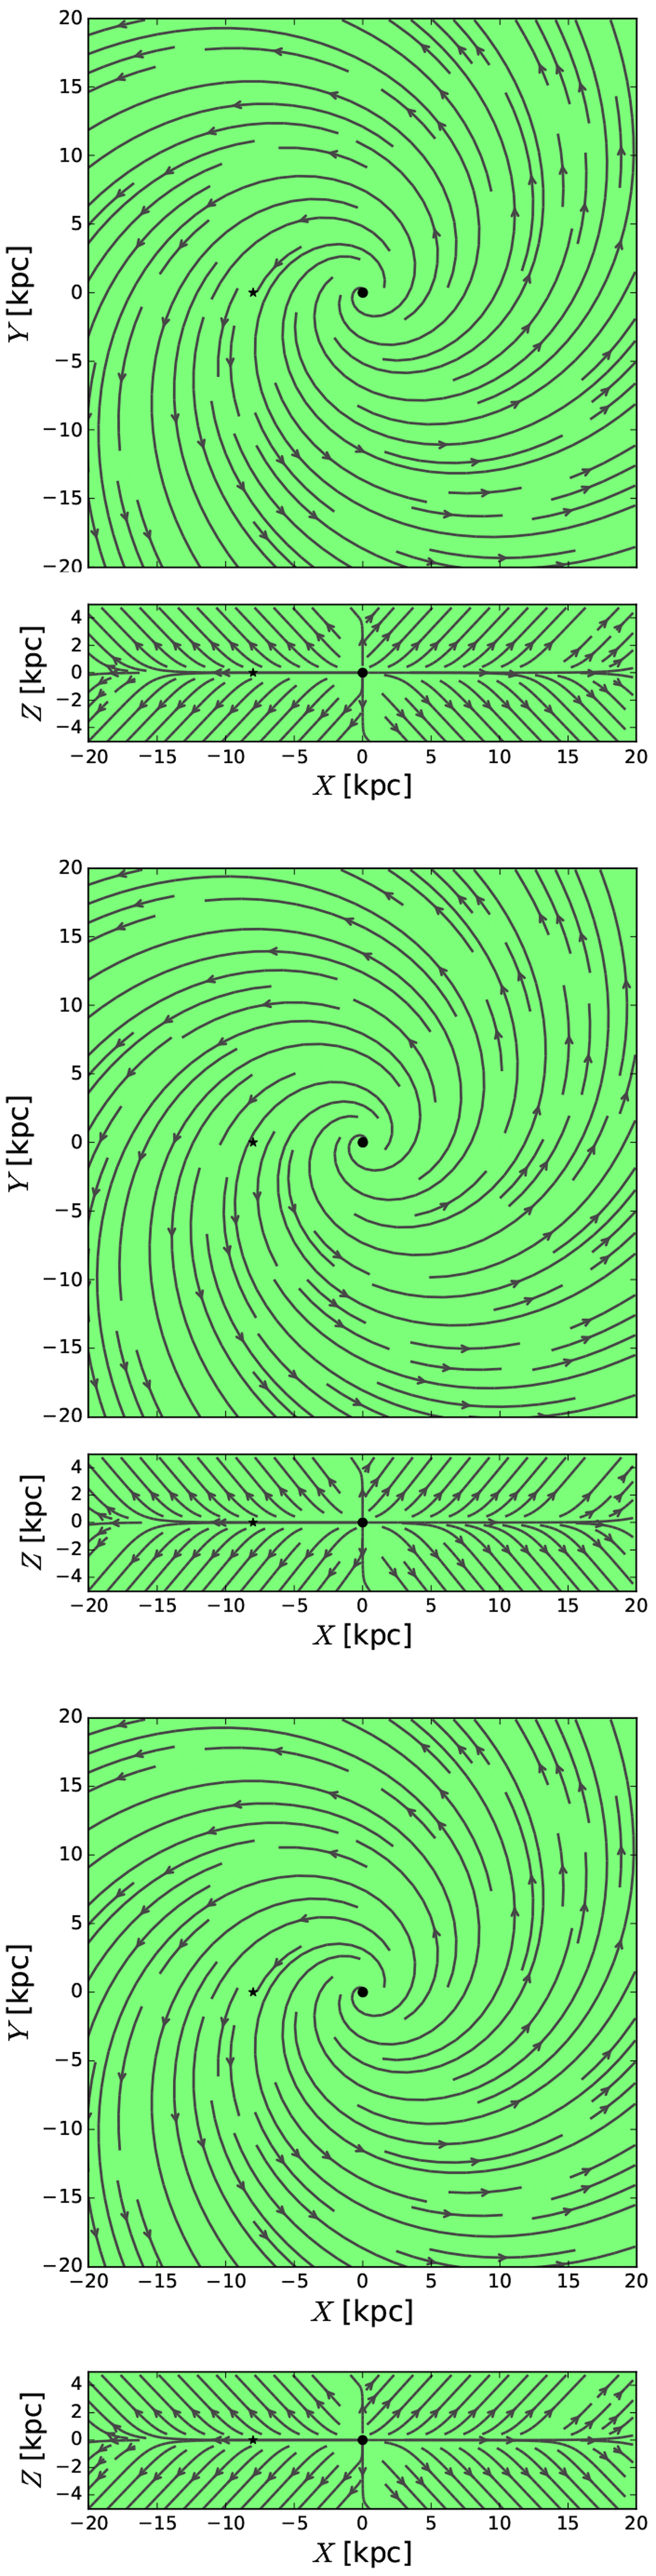
Reconstructed GMF structures in the XY plane (top) and XZ plane (bottom) in case A, case B, and case C, respectively, shown from top to bottom. See text for details. Similar plot for the input GMF model is shown in Fig. A.1.
Current usage metrics show cumulative count of Article Views (full-text article views including HTML views, PDF and ePub downloads, according to the available data) and Abstracts Views on Vision4Press platform.
Data correspond to usage on the plateform after 2015. The current usage metrics is available 48-96 hours after online publication and is updated daily on week days.
Initial download of the metrics may take a while.