Fig. 5
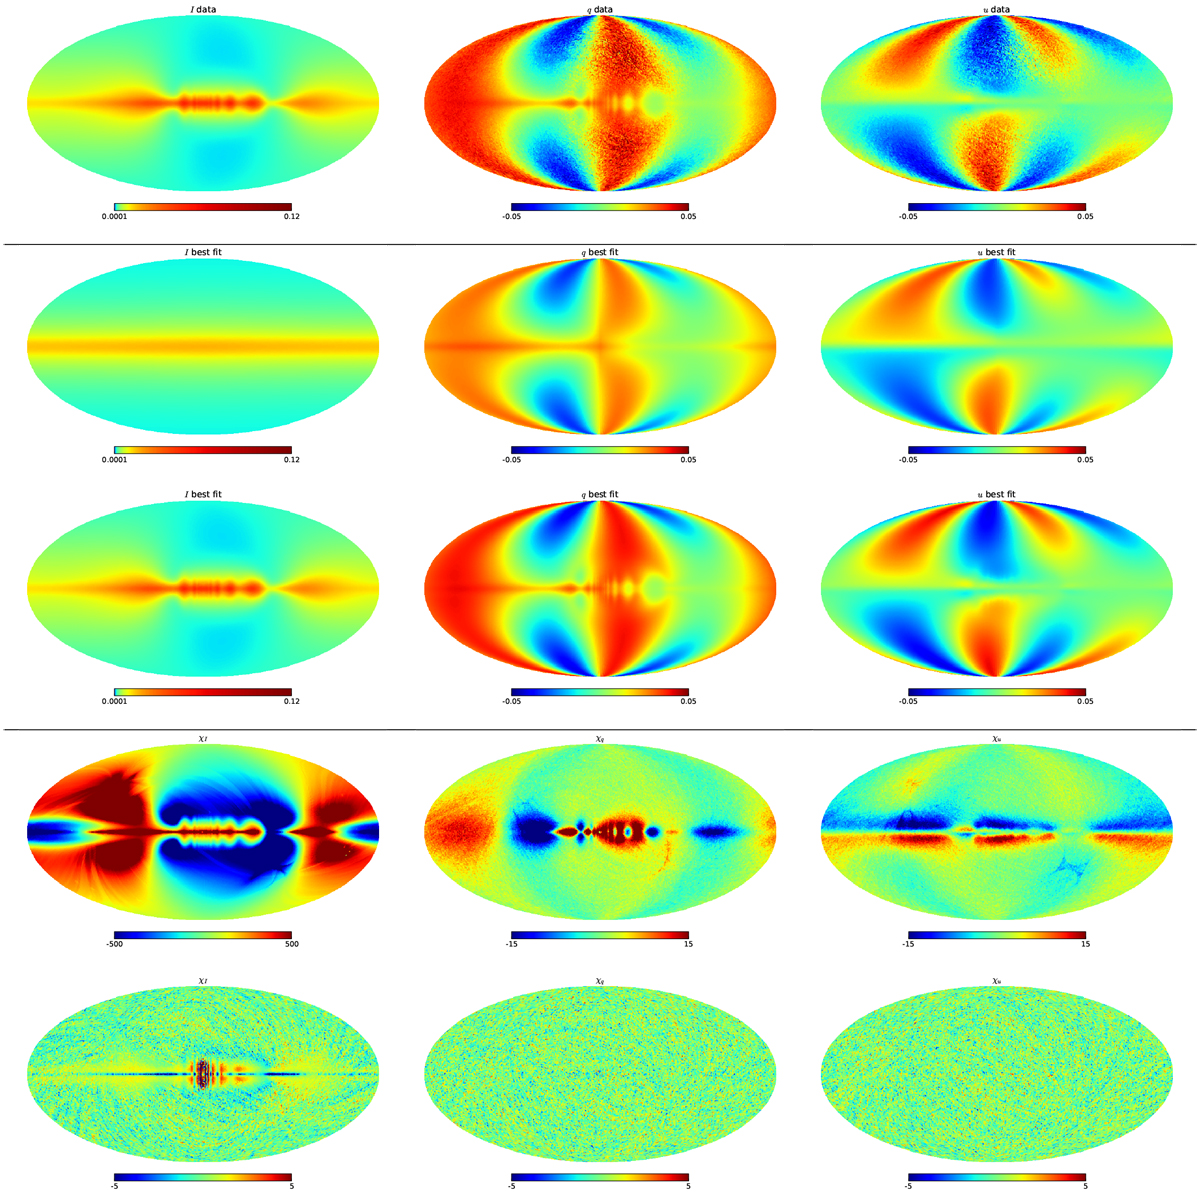
Maps corresponding to the modified Stokes I, q, and u from left to right. Top: data from the S2 simulation downgraded to Nside = 64; second row: best-fit maps obtained while assuming the dust distribution follows an ED model (case B); third row: best-fit maps obtained while assuming the dust distribution follows an ARM4 model (case C). The two last rows show the significance of the residuals for the case B (4th row) and the case C (5th row). For the case B, the color scales range from −500 and 500 and from −15 to 15 for the intensity and the polarization, respectively. For the case C, color scales range from −5 to 5, as in Fig. 4.
Current usage metrics show cumulative count of Article Views (full-text article views including HTML views, PDF and ePub downloads, according to the available data) and Abstracts Views on Vision4Press platform.
Data correspond to usage on the plateform after 2015. The current usage metrics is available 48-96 hours after online publication and is updated daily on week days.
Initial download of the metrics may take a while.