Fig. C.2
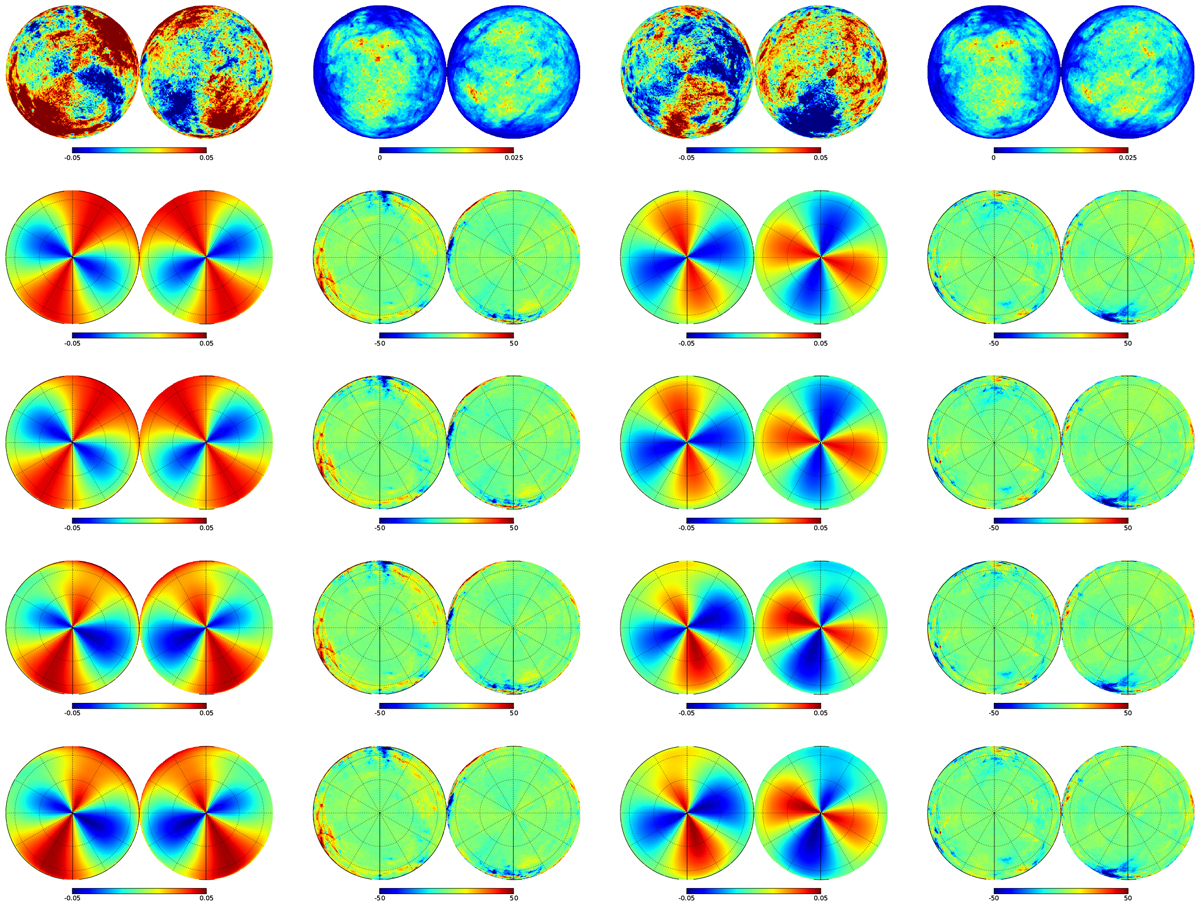
Orthographic view of the polarization maps. First row shows the 353-GHz maps of the reduced Stokes parameters from Planck downgraded at Nside = 64 and the corresponding map of uncertainties that we use to compute the χ2 (q, σq, u, σu). Rows 2–5: GMF models labeled ASS, LSA, BSS, and QSS using the best-fit of the ED nd model. The obtained best fits are shown in the first and third columns and the statistical significance of their residuals, per-pixel, are shown in the second and fourth columns. The same convention is used as for Fig. C.1.
Current usage metrics show cumulative count of Article Views (full-text article views including HTML views, PDF and ePub downloads, according to the available data) and Abstracts Views on Vision4Press platform.
Data correspond to usage on the plateform after 2015. The current usage metrics is available 48-96 hours after online publication and is updated daily on week days.
Initial download of the metrics may take a while.