Open Access
Fig. 20
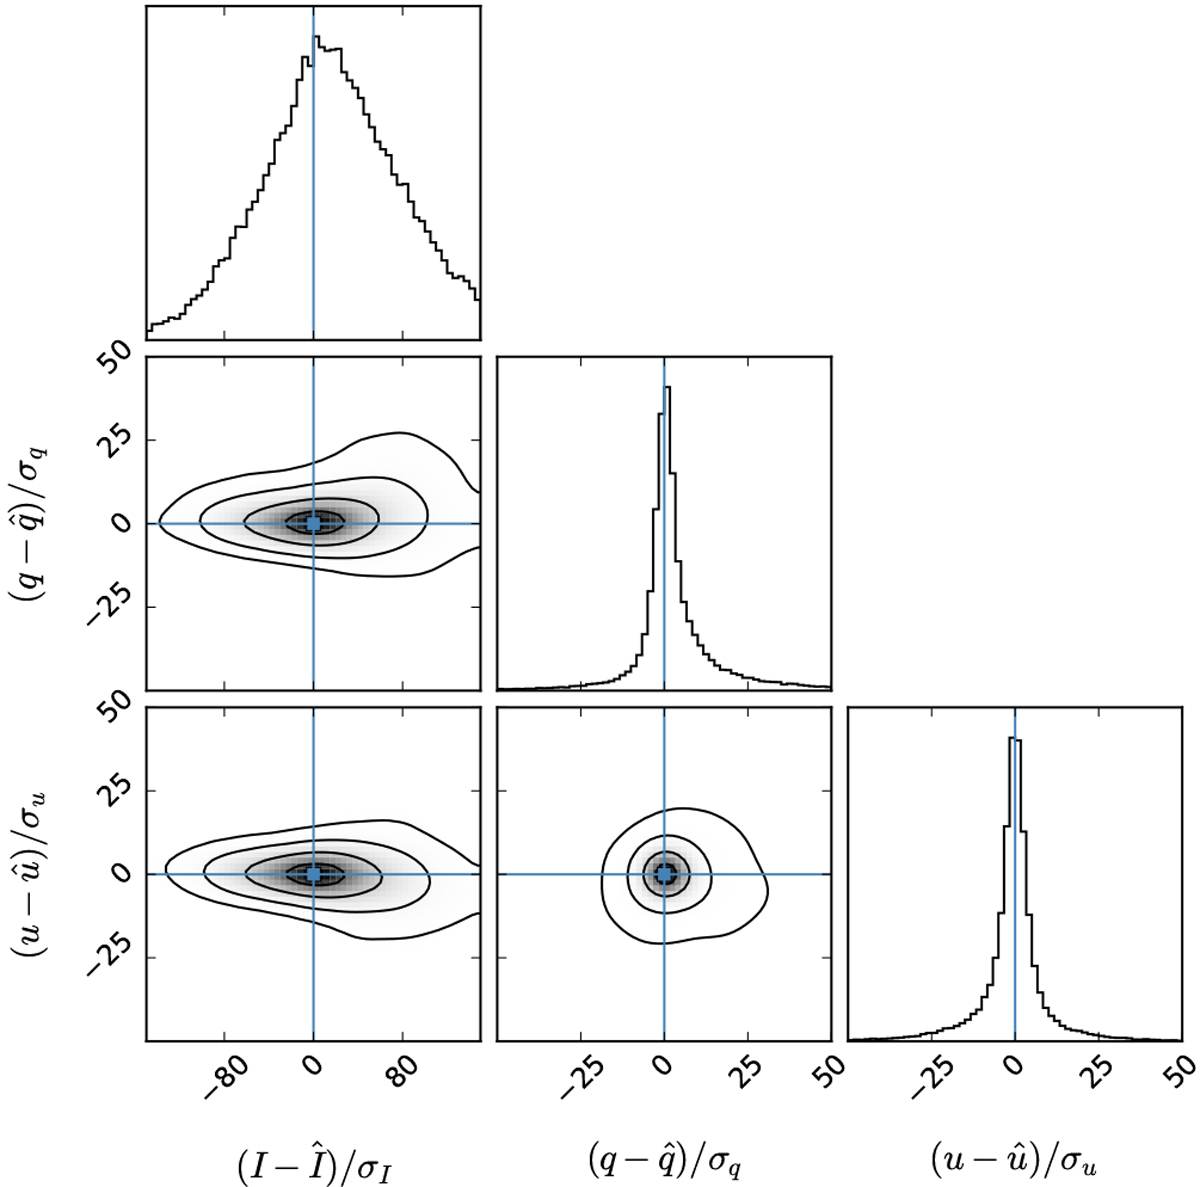
Corner plot showing the correlations between the significance of the residuals in I, q, and u. This figure corresponds to the modeling with the ARM4⊕ED nd model and with the QSS GMF model.
Current usage metrics show cumulative count of Article Views (full-text article views including HTML views, PDF and ePub downloads, according to the available data) and Abstracts Views on Vision4Press platform.
Data correspond to usage on the plateform after 2015. The current usage metrics is available 48-96 hours after online publication and is updated daily on week days.
Initial download of the metrics may take a while.