Fig. 19
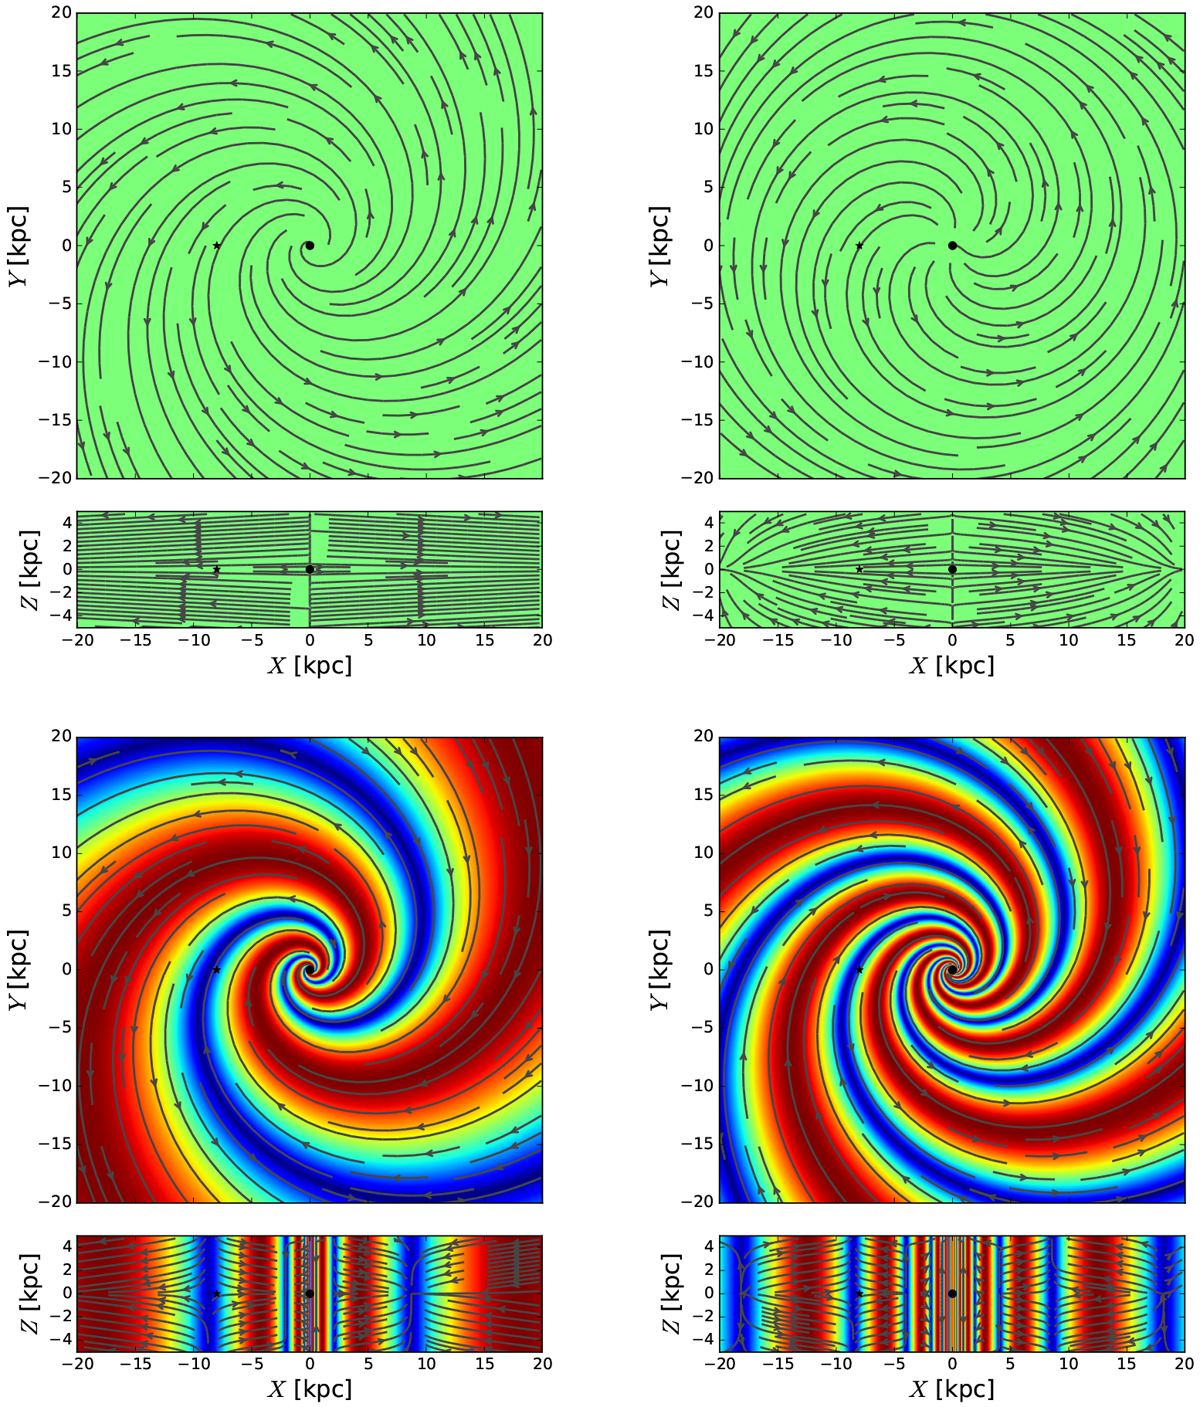
Fieldline geometrical structures of best-fit GMF models in the (x, y, z = 0) and (x, y = 0, z) planes of the Galaxy. From top-left to bottom-right: ASS, LSA, BSS, and QSS GMF models. The GMF reconstructed models corresponds to the best-fits obtained while assuming that nd is our best-fit ED model. The black dot at the center of the figure is the Galactic center and the black star is at the Sun position. The color scales offer information about the relative strength of GMF (i.e., the norm of the vector field at each location) and of its direction (red going clockwise, blue going counter-clockwise). In the case of ASS and LSA models, the (constant) norm has been fixed to 2.1.
Current usage metrics show cumulative count of Article Views (full-text article views including HTML views, PDF and ePub downloads, according to the available data) and Abstracts Views on Vision4Press platform.
Data correspond to usage on the plateform after 2015. The current usage metrics is available 48-96 hours after online publication and is updated daily on week days.
Initial download of the metrics may take a while.