Open Access
Fig. 17
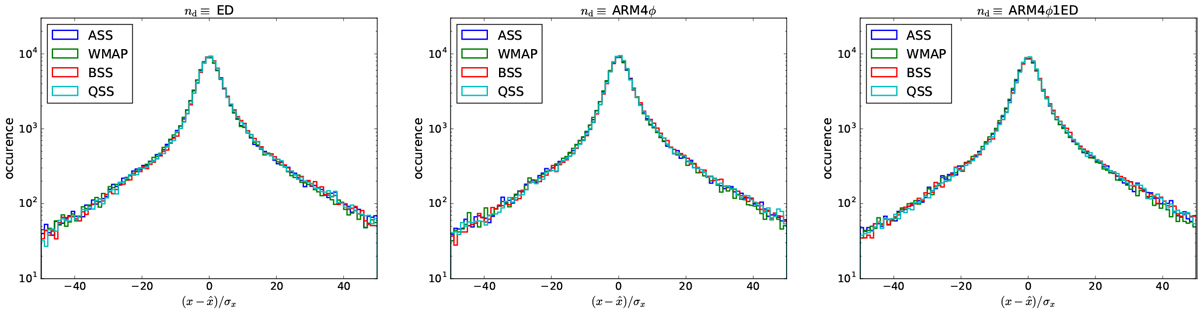
Histograms of the significance of the residuals. x stands for the concatenation of the q and u parameters. Each GMF model is represented by a different color and each panel corresponds to a different underlying nd model: ED, ARM4, and ARM4⊕ED from left to right.
Current usage metrics show cumulative count of Article Views (full-text article views including HTML views, PDF and ePub downloads, according to the available data) and Abstracts Views on Vision4Press platform.
Data correspond to usage on the plateform after 2015. The current usage metrics is available 48-96 hours after online publication and is updated daily on week days.
Initial download of the metrics may take a while.