Fig. 14
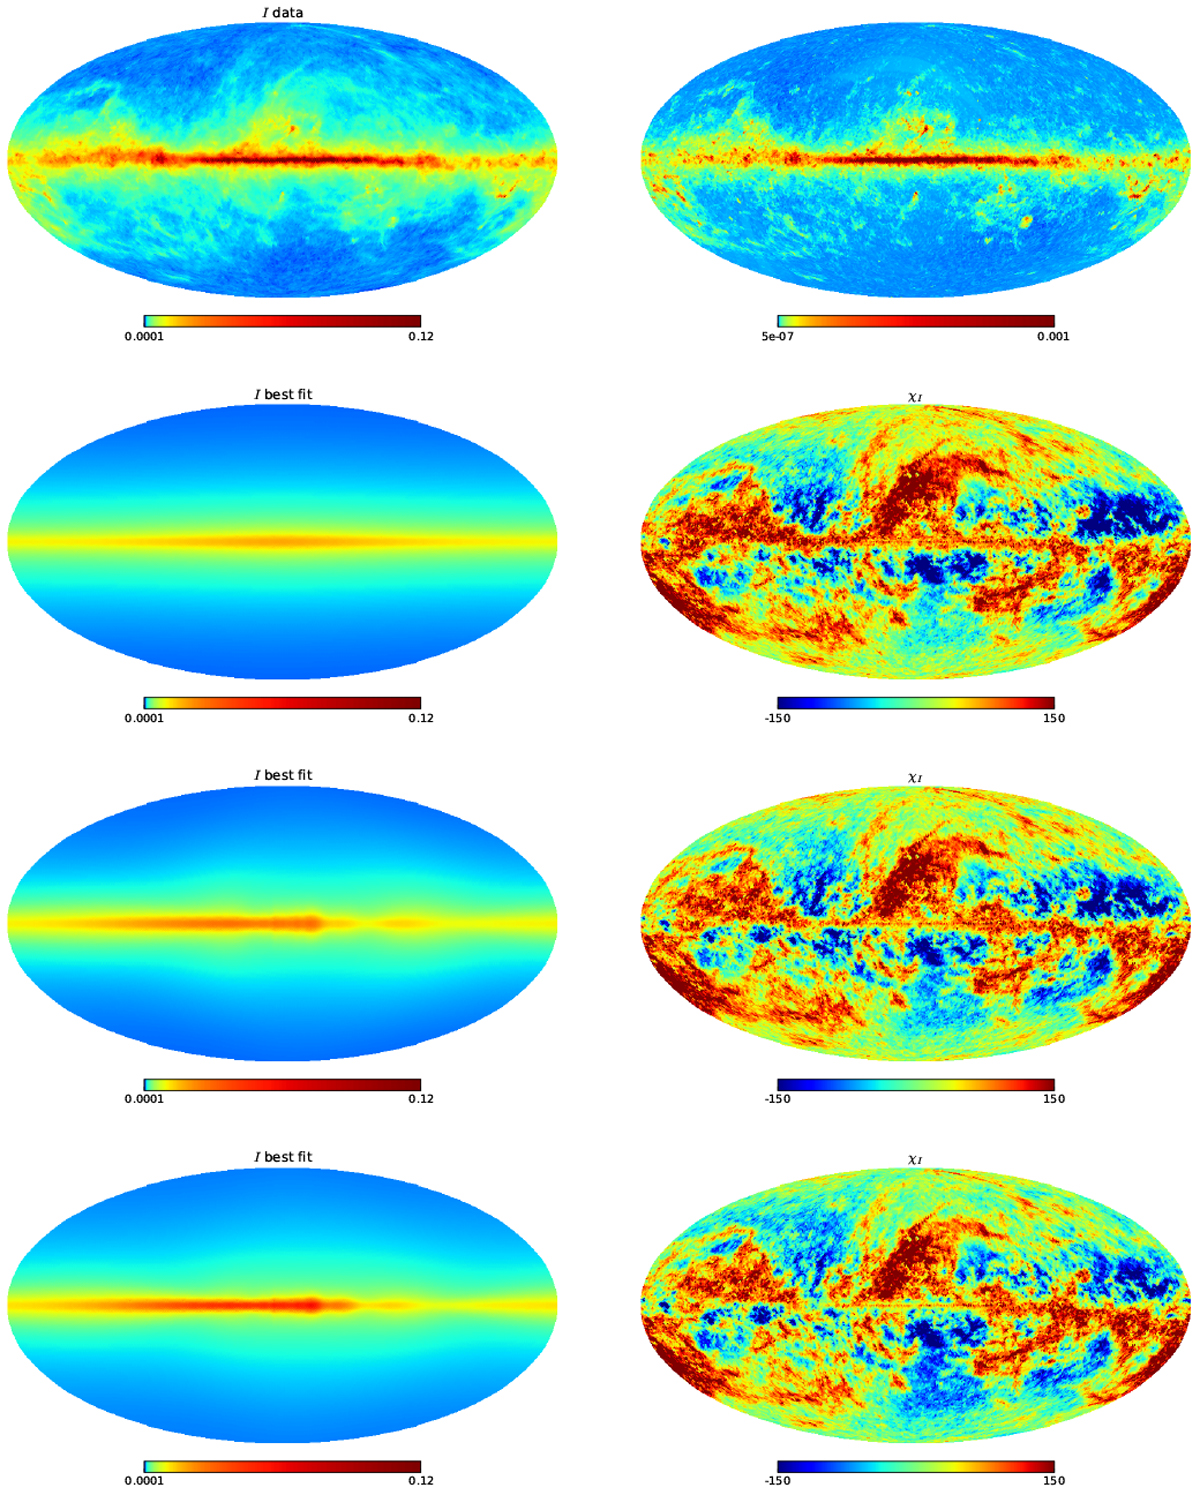
Intensity maps. First row: 353-GHz map from Planck downgraded at Nside = 64 and the corresponding map of uncertainties that we use to compute the χ2. Rows two to four correspond to dust density distribution models labeled ED, ARM4, and ARM4⊕ED, respectively.The obtained best-fits are shown in the first column and the statistical significance of the residual, per-pixel, are shown in the second column.
Current usage metrics show cumulative count of Article Views (full-text article views including HTML views, PDF and ePub downloads, according to the available data) and Abstracts Views on Vision4Press platform.
Data correspond to usage on the plateform after 2015. The current usage metrics is available 48-96 hours after online publication and is updated daily on week days.
Initial download of the metrics may take a while.